
The Cash-Cows of DeFi 🐂 - 6 Tokens With Strong Revenue🏆
An analysis of 6 fundamentally sound projects with large recurring revenue.

Introduction
Crypto is maturing. Institutional demand is increasing as tradfi wants exposure to the asset class through products such as a BTC ETF. At the same time, digital RWAs are on the rise which bridges the gap between on-chain and off-chain finance. As this is taking place, it’s only logical to assume that fundamentals will matter to a higher and higher extend. So what products attract organic demand? Which protocols have a positive bottom line? What are the top revenue generating tokens? This article will aim to answer this by diving into 6 protocols with strong recurring revenue 💸
Enjoy this type of research?🧐 Subscribe to show your support and receive more free reports like this in the future 🗞
Comparative analysis at the bottom of the article👇
Maker
MakerDAO, the issuer of the DAI stablecoin, has established itself as one of the leading revenue generating protocols in crypto. This has especially been the case ever since Maker began onboarding real world assets (RWAs) as collateral for DAI back in 2022.
Business model - Maker charges a stability fee on all collateral backing $DAI
Annualized fees:
$40.6m - Monetalis Clydesdale (RWA)
$29.4m - Blocktower Andromeda (RWA)
$19.8m - stETH low fee
$14.9m - Coinbase custody (RWA)
$12.1m - stETH balanced
$10.1m - ETH low fee
$10m - Spark direct credit line
$8.1m - ETH balanced
$7.2m - GUSD (Gemini USD)
$14m - Remaining collateral
$166.2m - total
View the full collateral list here.
At the time of writing, 55% of the Maker revenue comes from RWA yields. An annualized revenue of $166m places Maker as the #1 DeFi protocol in terms of yearly revenue. According to Token Terminal, Ethereum and Tron are the only two on-chain entities with revenue above $166m the past 365 days.
So how likely is the current revenue to continue and is $166m annualized realistic?
As mentioned, all collateral backing DAI generates revenue via the ‘stability fee’ which is the interest paid by $DAI borrowers. The stability fee from on-chain collateral (such as stETH, wBTC etc.) is decided by governance and the RWA collateral vaults depend on the interest rate in the U.S. As these are fairly stable, the main way Maker can increase its revenue is by growing the $DAI supply - and that’s exactly what’s prioritized right now👇
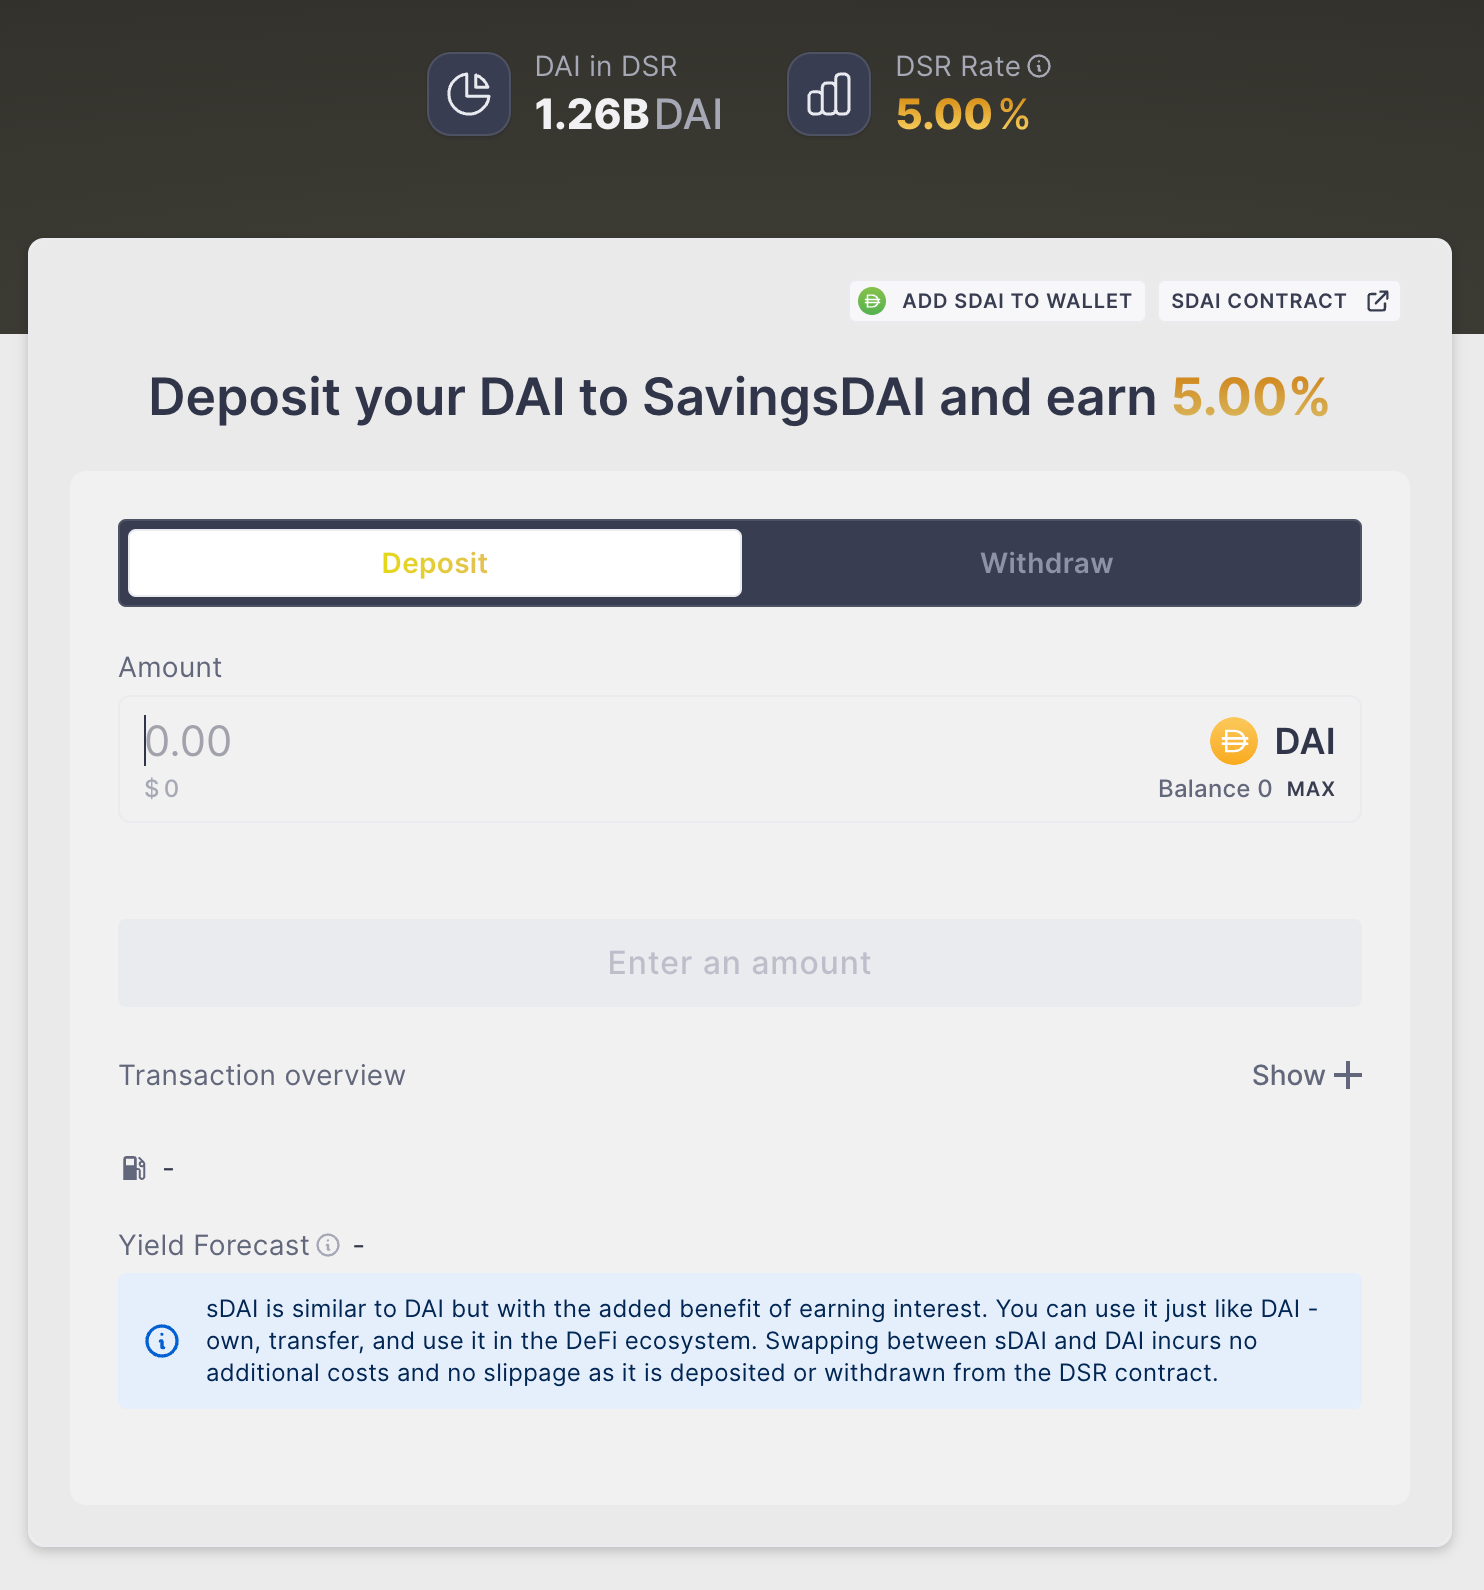
The DAI savings rate (DSR) is a vault on the Spark protocol (native Maker lending market) which pays out 5% APY to DAI stakers. This creates additional utility for DAI and since this went live, the DAI supply has grown by ~800m. The yield comes from the revenue generated on the protocol and is therefore a pretty hefty expense to the protocol as seen below (DSR cost).
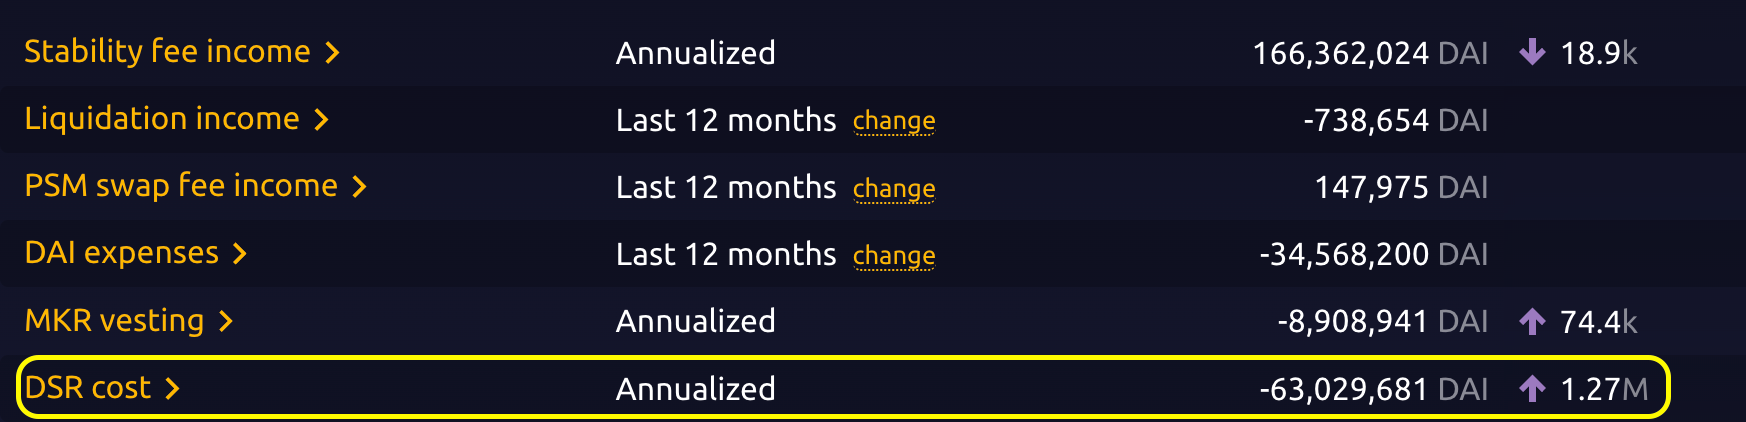
While this impacts the earnings for Maker short term, it could help grow the DAI supply and increase revenue long term. It’s therefore a pretty good strategy despite being a large cost for the protocol currently.
Another increase in revenue could come from the blocktower Andromeda RWA vault which is only roughly half filled in terms of $DAI minted. If this reaches its cap over the coming weeks/months, the annualized revenue will increase by ~$28.3m.
$MKR stats👇
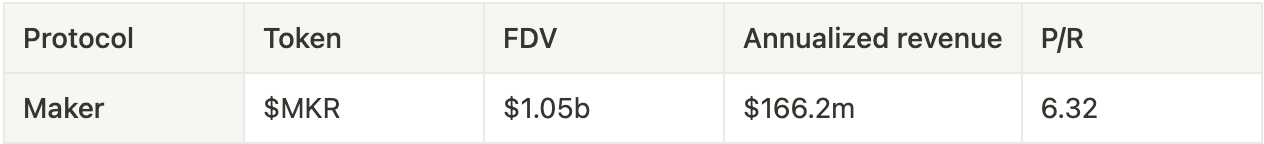
$MKR is trading at a quite good valuation given current revenue estimates. This is especially also the case, if you believe the DAI supply will increase in the future.
As 55% of the revenue comes from RWAs like US treasuries, it’s worth noting that this revenue will decrease if US interest rates decline. Is it safe to assume that rates will stay relatively high for at least the next year? Probably yes.
There are many things coming to Maker in the future such as a 1:12000 token split, sub-dao’s and the ability to earn $DAI by staking $MKR. More on this in a future article. Don’t forget to subscribe if that sounds interesting👇
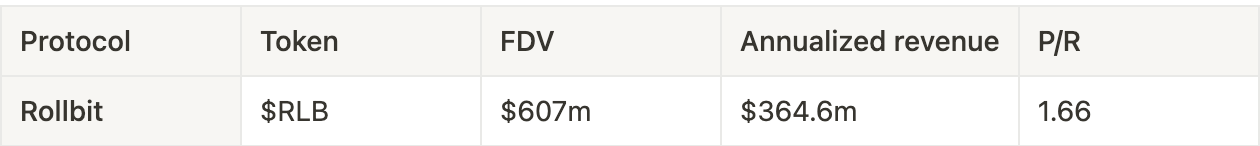
Rollbit

While it’s a stretch including Rollbit in an article about DeFi protocols due to its centralized nature, it’s included today due to the protocol’s enormous revenue and the fact that users can get exposure to this through the $RLB token.
Perhaps we should refer to the space as on-chain finance rather than decentralized finance?
Rollbit is an on-chain centralized casino which also offers sports betting and leveraged perpetual trading of a large variety of crypto tokens. Their stats are nothing short of impressive as they generate a ton of revenue from their various products as seen below.
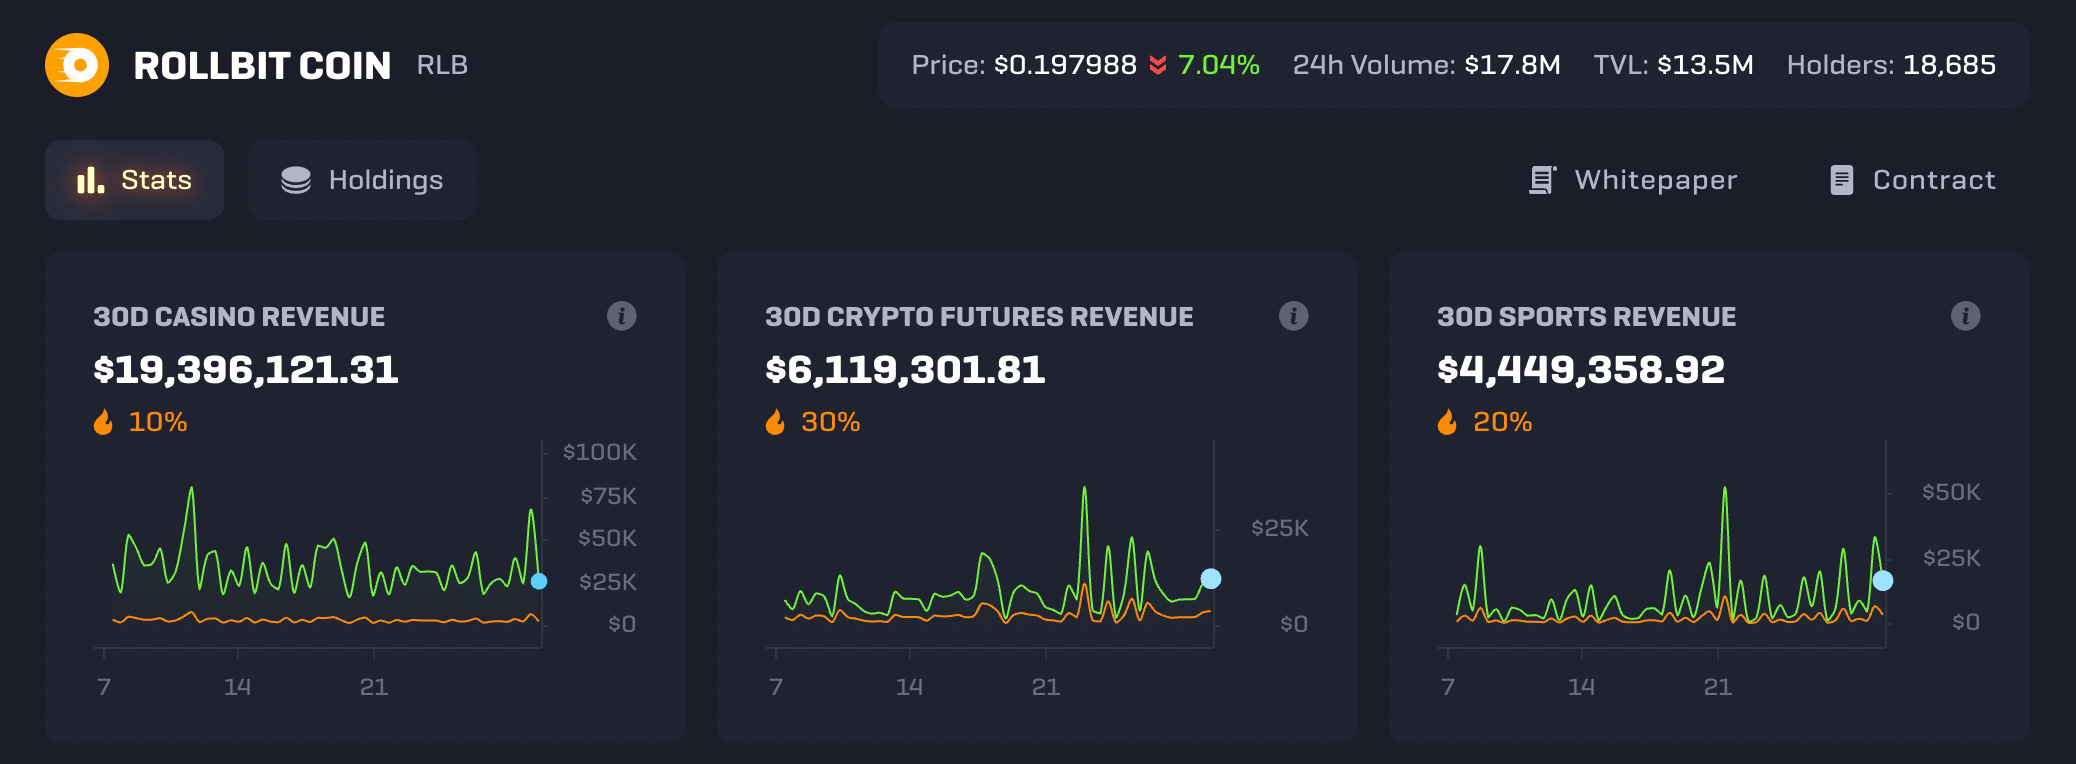
The image shows the daily revenue generated from the casino, futures trading and sports betting. A portion of the revenue is used to buy and burn $RLB (10%, 30% and 20% respectively). This puts significant buy pressure on $RLB. With current revenue, $55m of RLB is burned per year which is 9% of the supply given current price. If $RLB increases in price, the burn will have a less significant impact on the supply of $RLB. The narrative around the buy and burn mechanism is likely what’s more significant however as it creates hype amongst investors. Whenever someone talks about investing in $ETH, the burn is mentioned and we saw last year how big of a role the narrative around the $LUNA burn impacted the price of the token.
Below is a table of Rollbit annualized revenue given recent 30-day metrics.
It’s not possible to view historic data on the revenue as Rollbit is centralized. It is however possible to track the RLB burn on-chain which confirms that the 30d numbers are high likely true.
While it’s difficult to determine whether current revenue levels will be maintained in the future, it’s worth noting that this is generated in a bearish environment with low volatility. If volatility and general crypto activity picks up, the perpetual crypto exchange should see an increase in revenue as well. Rollbit further has a quite intuitive UI/UX which could help them onboard non-crypto users to both their casino and crypto futures exchange.
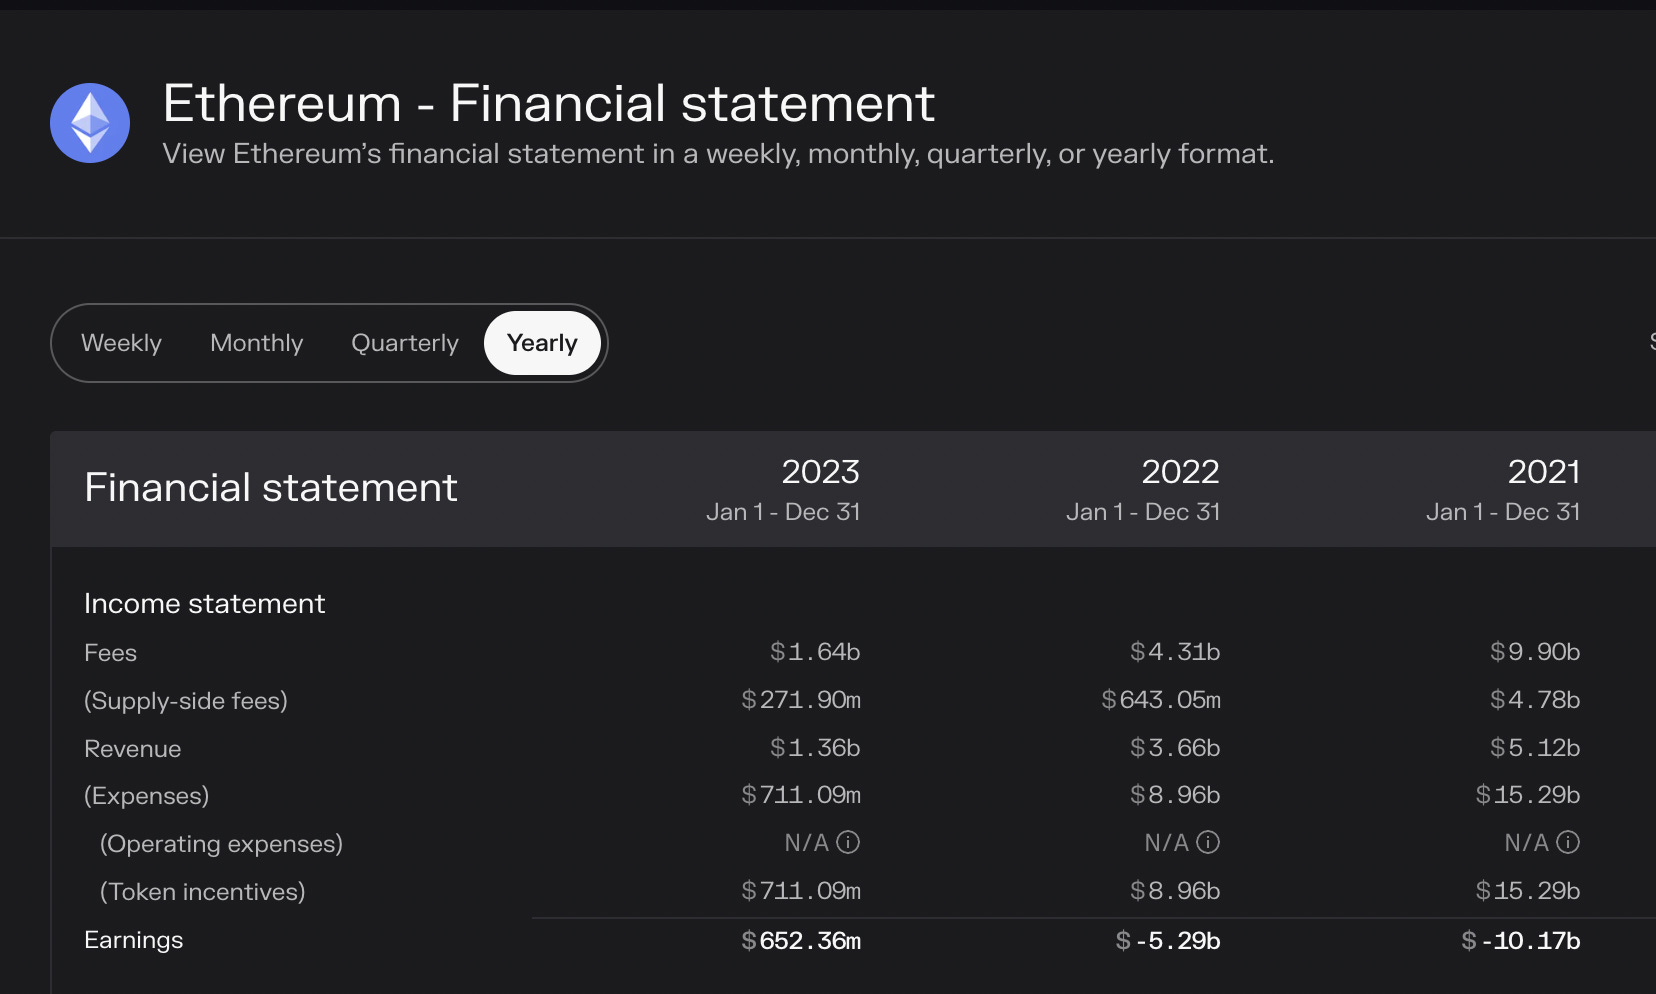
Ethereum
Not only is Ethereum the largest on-chain entity in terms of revenue generated, it’s also the only blockchain with positive earnings i.e higher revenue than costs (such as token inflation). Most blockchains have tokens with large inflation to incentivize stakers to secure the network. As Ethereum generates billions in fees every year from mainnet and rollup transactions, only a small amount of ETH is emitted. Additionally, since EIP-1559 a portion of ETH is burned with every transaction which makes ETH net deflationary on most days.
Below are some key metrics regarding revenue and an ETH valuation relative to this. In this instance, revenue is calculated as fees paid by users minus the amount going to Ethereum validators. Revenue is therefore the amount of ETH that’s burned and accrues indirectly to all holders of ETH.
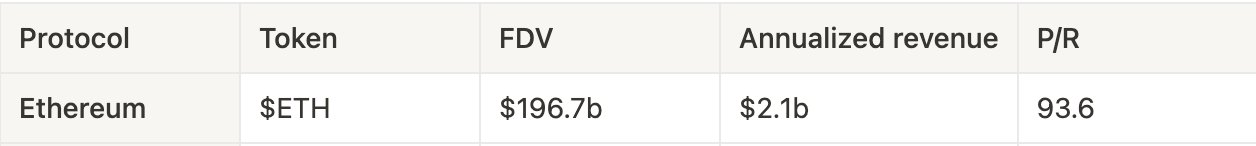
This year, Ethereum has generated $1.64b in fees so far of which $1.36b is revenue i.e $1.36b worth of ETH has been burned.
In the 2021 bull run, Ethereum generated nearly $10b in fees. As this was before the merge and EIP-1559 wasn’t implemented until half into the year, the revenue and earnings looked very different back then. If Ethereum were to generate $10b in fees in 2024, that would result in $8.4b in revenue i.e $8.4b worth of ETH being burnt🔥
GMX
GMX is a perpetual futures exchange on Arbitrum and Avalanche which went live in late 2021 and saw a massive inflow of traders in the latter half of 2022. The protocol was one of the first to introduce the ‘real yield‘ narrative which is centered around sharing revenue with token holders. Futures trading platforms have in general performed quite well this and last year relative to other sectors in DeFi. The reason? Leverage.
As leverage is incorporated seamlessly into the product, perp dexes are able to extract significantly more fees from users than other DeFi applications that don’t have built in leverage. This is also why perp dexes like GMX, Synthetix and Gains are amongst the top revenue generating protocols across DeFi.
With the GMX V1 model, 30% of fees are distributed to GMX stakers which can be considered as the protocol revenue. GMX has been successful in growing their platform in an organic way with low amount of token incentives. Today, many competitors have emerged such as Gains, Kwenta, Mux and Vertex that all have taken market share from GMX. Despite this, GMX still generates strong revenue which is portrayed below. This data is from both the V1 and V2 exchange.
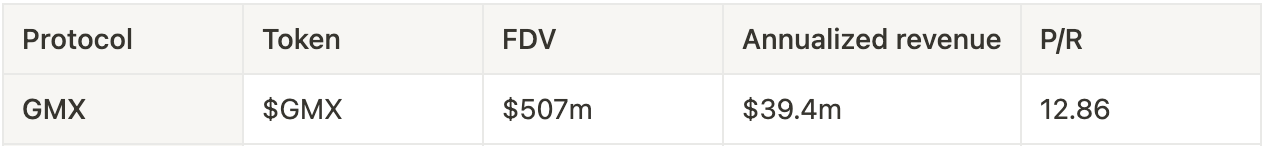
As mentioned, GMX has been loosing market share to competitors like Synthetix, Level, Vertex etc. The V1 mechanics were inferior to many of these alternative platforms due to high relative trading fees. V2 has not only reduced trading fees, but also introduced synthetic assets and reduced liquidity provider risk by introducing funding rates and price impact.
It’s also worth noting that many of the GMX competitors have large token incentives which are emitted to traders. Are users trading on GMX alternatives because they prefer the other product or because they are getting paid to do so in the short term? Both Vela and Level saw larger volume on several occasions relative to GMX earlier this year because they either teased an airdrop or paid out large incentives to traders. Now, both tokens are down 90% and so is trading activity. GMX doesn’t emit any $GMX to traders which makes the token a far more attractive investment and signals that there is organic demand for the product.
So while the on-chain perp space becomes more and more crowded, GMX could still capture a significant portion of this demand on a larger time frame. A final catalyst: GMX sits on 8m $ARB tokens which could be distributed to traders in the future. Perhaps to bootstrap activity on V2 at some point?
Arbitrum

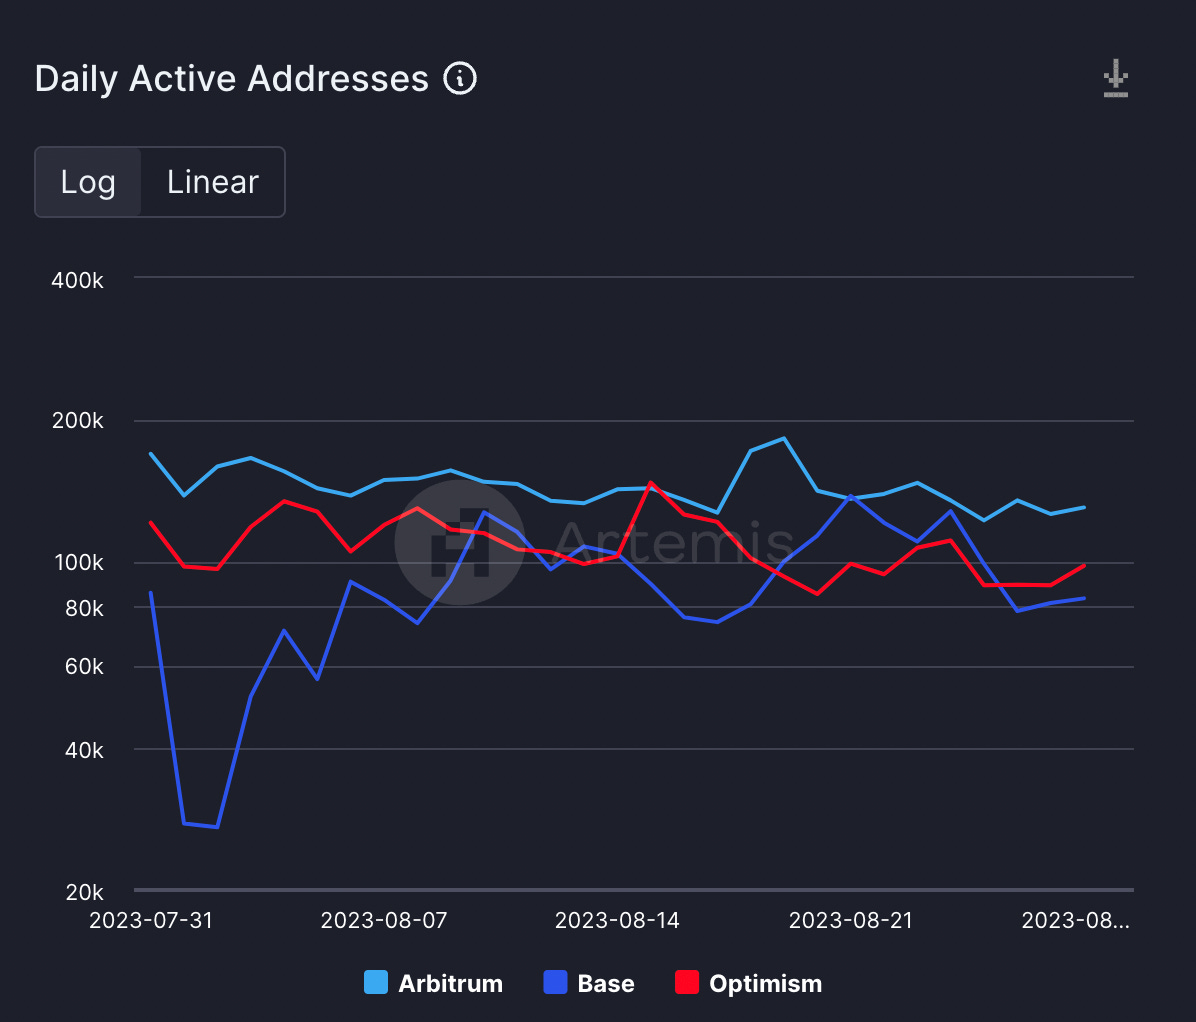
Arbitrum is the leading Ethereum rollup and has grown a large ecosystem without any token incentives (in contrast to Optimism). This year, Arbitrum has generated $41m in fees from users on the rollup whereas Optimism has generated $25m.
While new competitors have emerged recently such as Base, Mantle and many more, Arbitrum continues to be one of the chains with the highest activity and most liquidity.
From a technological standpoint, Arbitrum also has an advantage against other optimistic rollups as it has fraud proofs enabled (OP-chains do not). Offchain labs recently announced Arbitrum ‘Bold‘ which introduces permissionless state validation (anyone can challenge the state of the rollup).
Below is a table highlighting Arbitrum’s YTD annualized revenue and $ARB’s relative valuation.
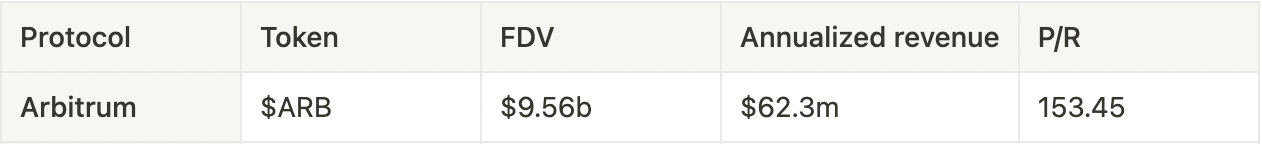
This is the highest revenue amongst all chains (L1s and L2s) after Ethereum which is quite impressive and indicates that a lot of activity has moved from alt-L1s to layer 2s. EIP-4844 is scheduled for later this which makes it cheaper for rollups to post data onto Ethereum mainnet. This improves the profit margin and could increase the revenue that Arbitrum and other rollups generate in the long term.
dYdX
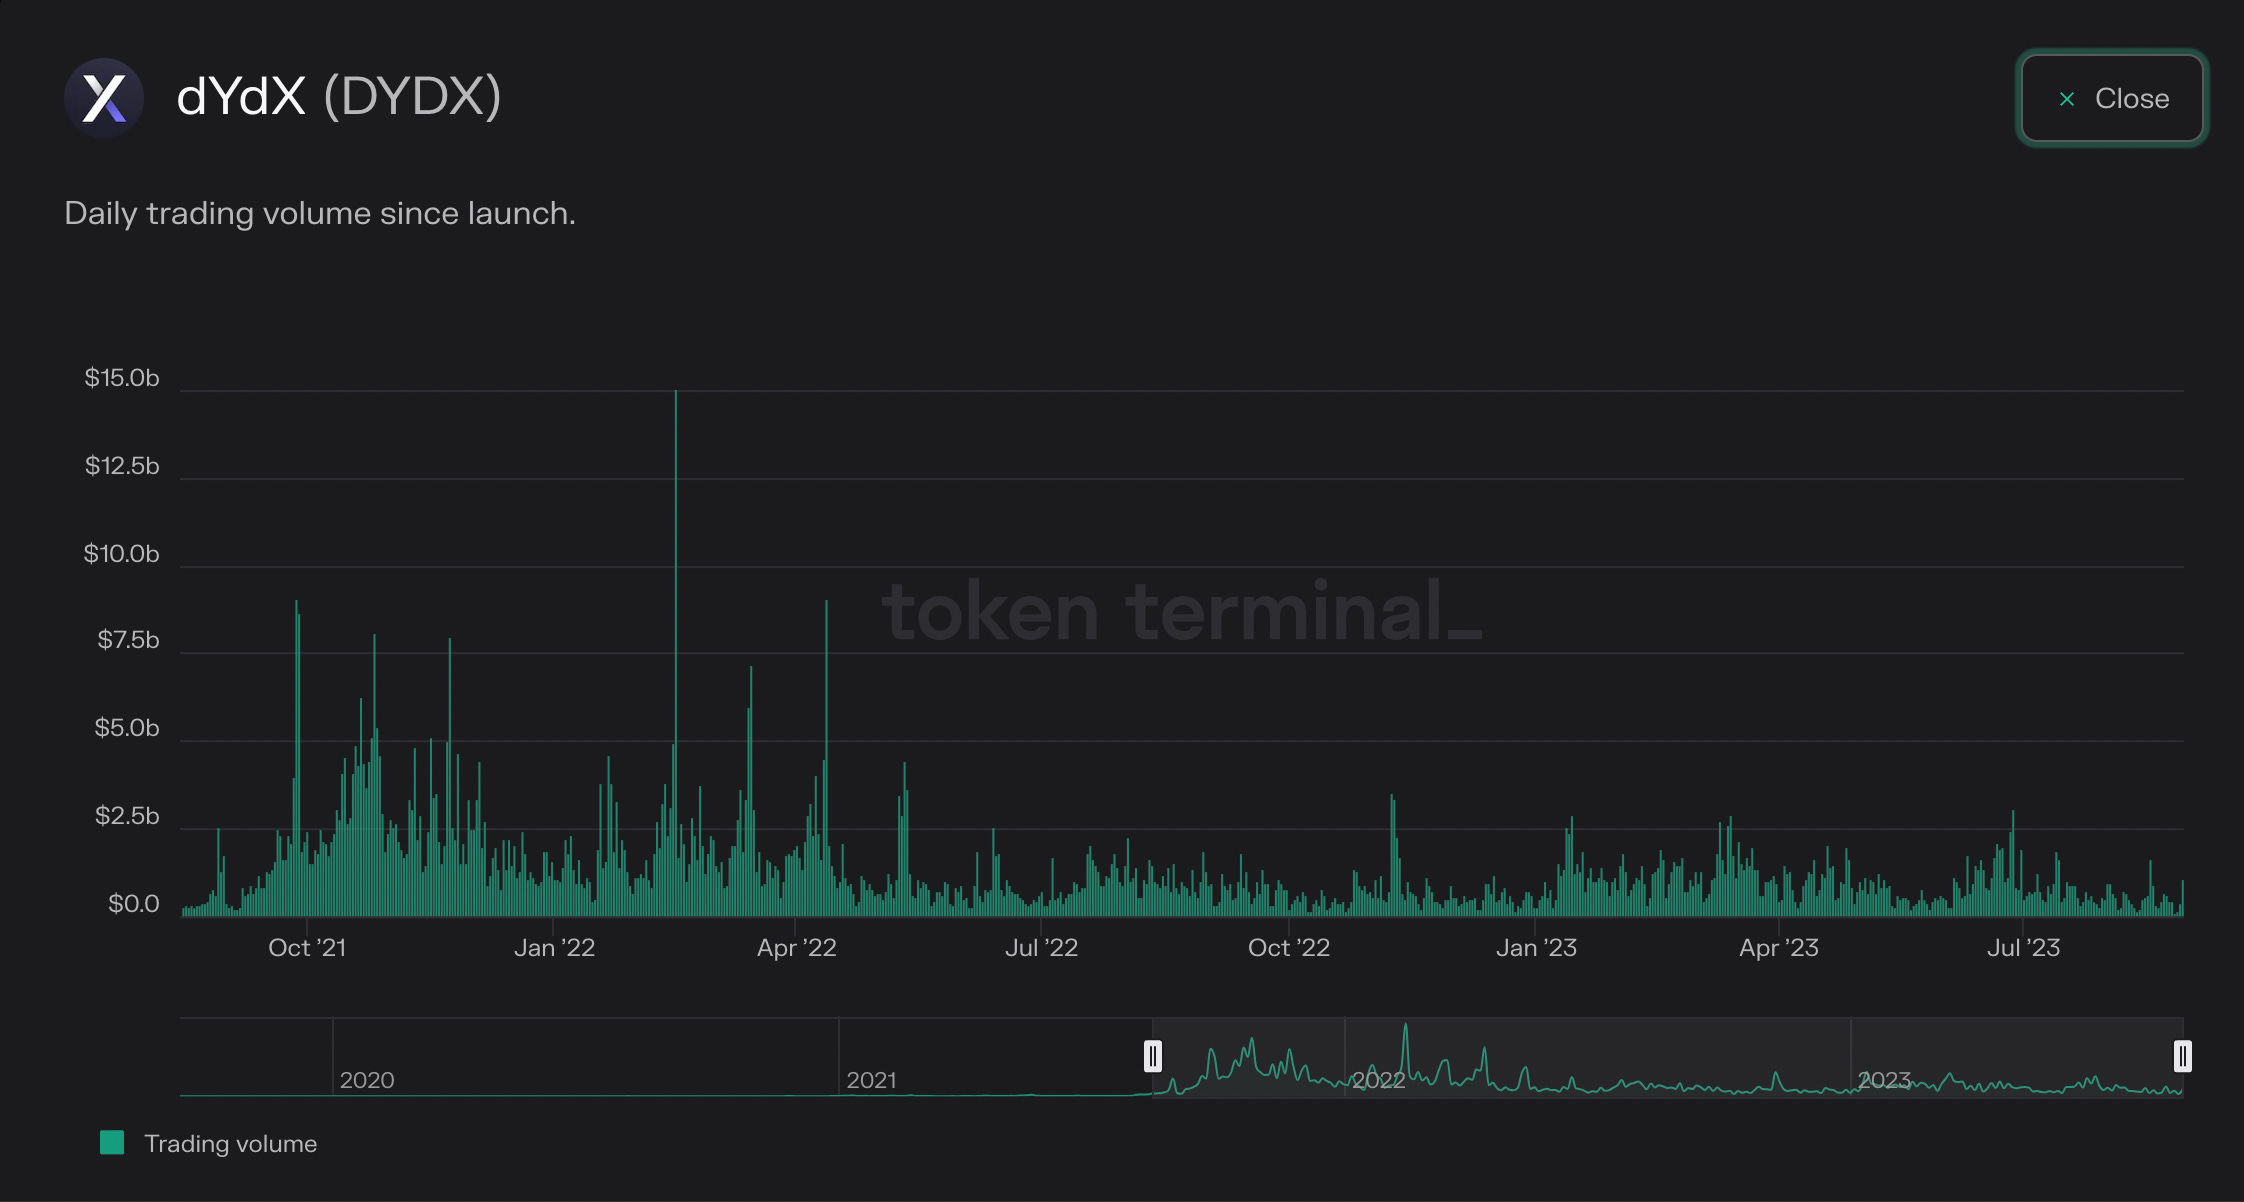
dYdX is the largest on-chain futures trading platform. They recently surpassed one trillion dollars in cumulative trading volume since launching in 2021 and a total of $426m generated in fees. dYdX offers a CEX like experience with cheaper fees than competitors like GMX and Kwenta and a mobile app as well.
To date, these fees have been going to centralized entities like dYdX trading Inc. With dYdX V4, which is just around the corner, fees generated from the trading platform will be distributed to validators and stakers. For anyone unfamiliar, dYdX will be launching on their own cosmos app-chain in late September with the purpose of increasing the decentralization.
While the $DYDX token has been pretty useless to date, the upcoming fee distribution could act as a catalyst for the token. It’s important to note however that large unlocks of $DYDX will begin in December and happen gradually over the next years. Below is a table of recent revenue and a relative valuation.
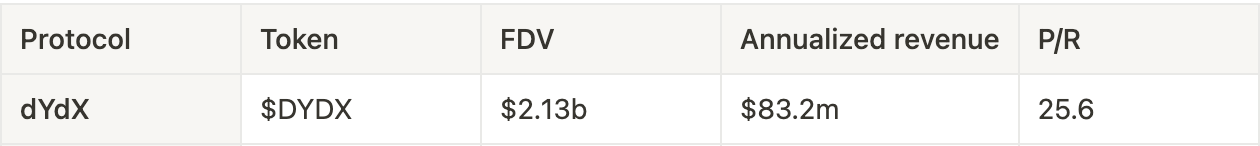
There is a vast difference between the $DYDX market cap ($370m) and the fully diluted valuation ($2.13b). While dYdX is one of the top revenue generating protocols in the space and has a large catalyst around the corner, there is significant supply overhang for the token which needs to be considered.
Comparative analysis
Below is a table summarizing the information presented in today’s article.
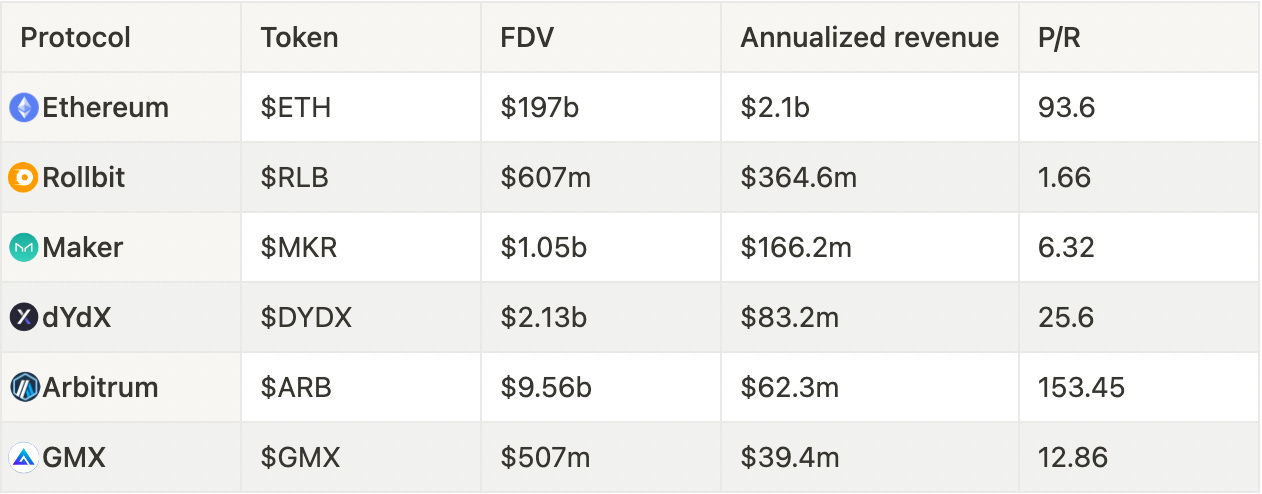
As seen, $RLB, $MKR and $GMX are trading at the best valuations relative to their revenues. Note however that many more things factor in when it comes to price performance such as narratives catalysts and general market behaviour.
That’s all! If you enjoyed the research, make sure to subscribe for more in the future👇
DISCLAIMER: The information provided in this document is for general informational purposes only and does not constitute financial, investment, or legal advice. The content is based on sources believed to be reliable, but its accuracy, completeness, and timeliness cannot be guaranteed. Any reliance you place on the information in this document is at your own risk. The document may contain forward-looking statements that involve risks and uncertainties. Actual results may differ materially from those expressed or implied in such statements. The author(s) of this document may or may not own positions in the assets or securities mentioned herein. They reserve the right to buy or sell any asset or security discussed at any time without notice. It is essential to consult with a qualified financial advisor or other professional to understand the risks and suitability of any investment decisions you may make. You are solely responsible for conducting your research and due diligence before making any investment choices. Past performance is not indicative of future results. The author(s) disclaim any liability for any direct, indirect, or consequential loss or damage arising from the use of this document or its content. By accessing this document, you agree to the terms of this disclaimer.


