
🀄️ DeFi Frameworks Newsletter #006
Your biweekly newsletter on the latest performance, news, catalysts and more


Welcome back to another issue of the DeFi Frameworks newsletter. In today’s addition, we will be covering an eventful week in terms of price action and market developments.
Bullets
- Market Overview 🗺
- News and Catalysts 📰
- Stablecoin Yields 🪙
Every week I aim to deliver a concise and information-packed newsletter presenting the top information needed as a DeFi investor. Subscribe below 🗞

Market Overview 🗺
This week has been generous to market participants, including DeFi which saw a whopping 19.94% uptick in Total Value Locked across the board.
!function(){"use strict";window.addEventListener("message",(function(e){if(void 0!==e.data["datawrapper-height"]){var t=document.querySelectorAll("iframe");for(var a in e.data["datawrapper-height"])for(var r=0;r<t.length;r++){if(t[r].contentWindow===e.source)t[r].style.height=e.data["datawrapper-height"][a]+"px"}}}))}();
Notably, of the $68.23b in liquidity across DeFi, one third is in liquid staking which indicates the large demand for native staking yield amongst investors. Note that by including liquid staking in this metric, some of the TVL is double counted.
The total onchain supply of stablecoins, which year-to-date has been bleeding, has finally seemed to have found a bottom. The chart signals that many investors have left the market this year. At this point, long term participants are left and a reversal of this downtrend could signal new inflow of participants and liquidity.
!function(){"use strict";window.addEventListener("message",(function(e){if(void 0!==e.data["datawrapper-height"]){var t=document.querySelectorAll("iframe");for(var a in e.data["datawrapper-height"])for(var r=0;r<t.length;r++){if(t[r].contentWindow===e.source)t[r].style.height=e.data["datawrapper-height"][a]+"px"}}}))}();
Displayed below is a chart indicating the performance of different popular market assets. It’s clear to see who the top performers are at the moment.
!function(){"use strict";window.addEventListener("message",(function(e){if(void 0!==e.data["datawrapper-height"]){var t=document.querySelectorAll("iframe");for(var a in e.data["datawrapper-height"])for(var r=0;r<t.length;r++){if(t[r].contentWindow===e.source)t[r].style.height=e.data["datawrapper-height"][a]+"px"}}}))}();
Looking at Ethereum’s financials, it’s safe to say that despite the recent bullish price performance, activity has slowed down drastically. If we do get an extended rally, onchain activity could start to pick up momentum once again which by extension would make Ethereum earnings turn positive.
!function(){"use strict";window.addEventListener("message",(function(e){if(void 0!==e.data["datawrapper-height"]){var t=document.querySelectorAll("iframe");for(var a in e.data["datawrapper-height"])for(var r=0;r<t.length;r++){if(t[r].contentWindow===e.source)t[r].style.height=e.data["datawrapper-height"][a]+"px"}}}))}();
The top 10 earners we’ve listed below have cumulatively generated ~$222.5m in revenue this month, with Tron and Ethereum doing most of the legwork. Unsurprisingly, Rollbit is still in the top 3 with its continuously strong earnings. The only protocol without a token in this list is friend.tech, which nonetheless outperformed some big players in the space.
!function(){"use strict";window.addEventListener("message",(function(e){if(void 0!==e.data["datawrapper-height"]){var t=document.querySelectorAll("iframe");for(var a in e.data["datawrapper-height"])for(var r=0;r<t.length;r++){if(t[r].contentWindow===e.source)t[r].style.height=e.data["datawrapper-height"][a]+"px"}}}))}();
All in all, it’s definitely not over for us yet, but we aren’t exactly back either. Might be a good idea to keep a keen eye on the market before jumping in without conviction.

News & Catalysts 📰
Now, we’ll be discussing the biggest and note-worthy events of this week.
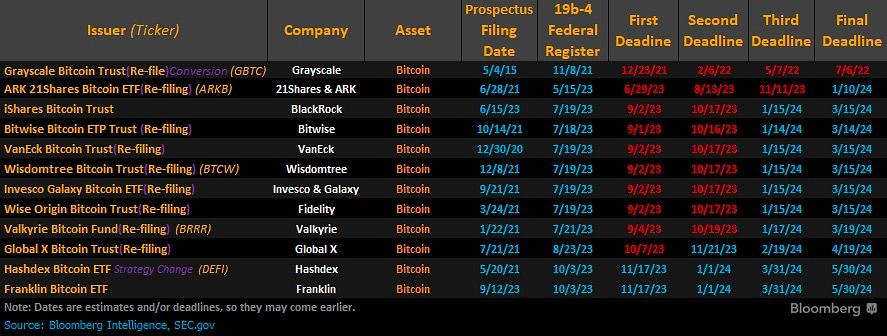
1️⃣ Spot ETF Update
It's been a hectic week regarding the approval of a spot Bitcoin ETF, leaving investors in a state of confusion and uncertainty ever since the Cointelegraph misinformation fiasco.
Earlier this week, investors noticed that BlackRock’s proposed iShares Bitcoin Trust was listed in DTCC’s reference database under the ticker “IBTC”, sparking a rally that many have been longing for with the orange coin surpassing $35,000. To everyone’s surprise it was de-listed from the Depository Trust and Clearing Corporation’s database only a day later, causing the price to tank below the recently reclaimed high. It was then re-listed the very same day and can be seen here. Some very suspicious activity indeed.
Word has spread that a spot Bitcoin ETF will be approved some time in 2024 with CFTC Commissioner Summer Mersinger believing that the market is indeed ready for this product.
2️⃣ Frax launched sFRAX
Venturing in to the world of Real World Assets (RWA) with the release of Frax v3, the team introduced staked Frax (sFRAX) to the market, allowing their native stablecoin FRAX to become yield-bearing.
The yield is generated through:
- US Treasury Bills
- FDIC insured savings accounts
- variety of AMO (Alrgorithmic Market Operations Controller) mechanics
With an initial yield of about 10%, it currently sits at 6.84% and will eventually stabilize at around ~5.4%. All off-chain activity is conducted through a Delaware based corporation named “FinresPBC”.
!function(){"use strict";window.addEventListener("message",(function(e){if(void 0!==e.data["datawrapper-height"]){var t=document.querySelectorAll("iframe");for(var a in e.data["datawrapper-height"])for(var r=0;r<t.length;r++){if(t[r].contentWindow===e.source)t[r].style.height=e.data["datawrapper-height"][a]+"px"}}}))}();
As seen on the chart - in 7 days they have amassed more than $40m in deposits, peaking at about ~$43m. The supply seems to have stabilized and no further exponential growth can be spotted. With pending integrations and data aggregators working on listing its data, room for growth exists as it currently has only 181 holders.
Stablecoin Yields 🪙
With the introduction of sDAI and other developments, plenty of attractive opportunities to earn significant yield on your stablecoins have appeared. We’ll be covering some of them with an interesting strategy at the end of the section.
sDAI, fUSDC & crvUSD on Pendle (and Penpie)
In previous iterations of the DeFi Frameworks Newsletter, we’ve taken a look at Pendle and what they have to offer. If you are unfamiliar with the platform, take a look at my short video guide on it here.
Pendle offers yield opportunities for many different assets, of which several are stablecoins. In addition, there are two main types of yield you can earn with variations for the latter:
fixed yield (depositing tokens in their yield-trading market)
liquidity provider yield (depositing LP tokens)
un-boosted (default)
boosted ( + locking PENDLE for vePENDLE)
In case you don’t want to lock any PENDLE tokens, but still wish to earn boosted yield, then look no further. Penpie allows depositors to receive additional yield on their stablecoin-LP tokens with no PENDLE lock-up thanks to their vePENDLE holdings. Most of their yield comes from Pendle’s incentives and the yield of the underlying token in addition to their own token (PNP) emissions alongside a small percentage of swap fees.
Risks: Smart contract risk on Pendle Finance & stablecoin issuer side. Little impermanent loss.
Below is a table that showcases potential yields:
!function(){"use strict";window.addEventListener("message",(function(e){if(void 0!==e.data["datawrapper-height"]){var t=document.querySelectorAll("iframe");for(var a in e.data["datawrapper-height"])for(var r=0;r<t.length;r++){if(t[r].contentWindow===e.source)t[r].style.height=e.data["datawrapper-height"][a]+"px"}}}))}();
Links for both of these protocols can be found here: Pendle, Penpie.
sDAI Gnosis Strategy
I recently talked about a potentially profitable strategy utilizing sDAI’s ~7.4% APR with the interest being paid from MakerDAO’s revenue.
The gist of the strategy is displayed on the flowchart:
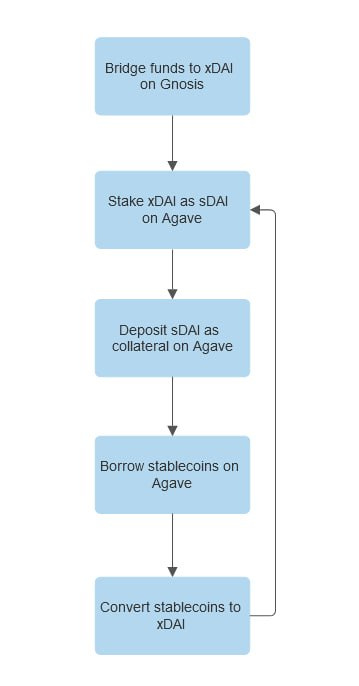
Note that this is in no way Financial Advice - refrain from using leverage if you lack clear understanding of it. This is a theoretical strategy that exists solely for educational purposes.
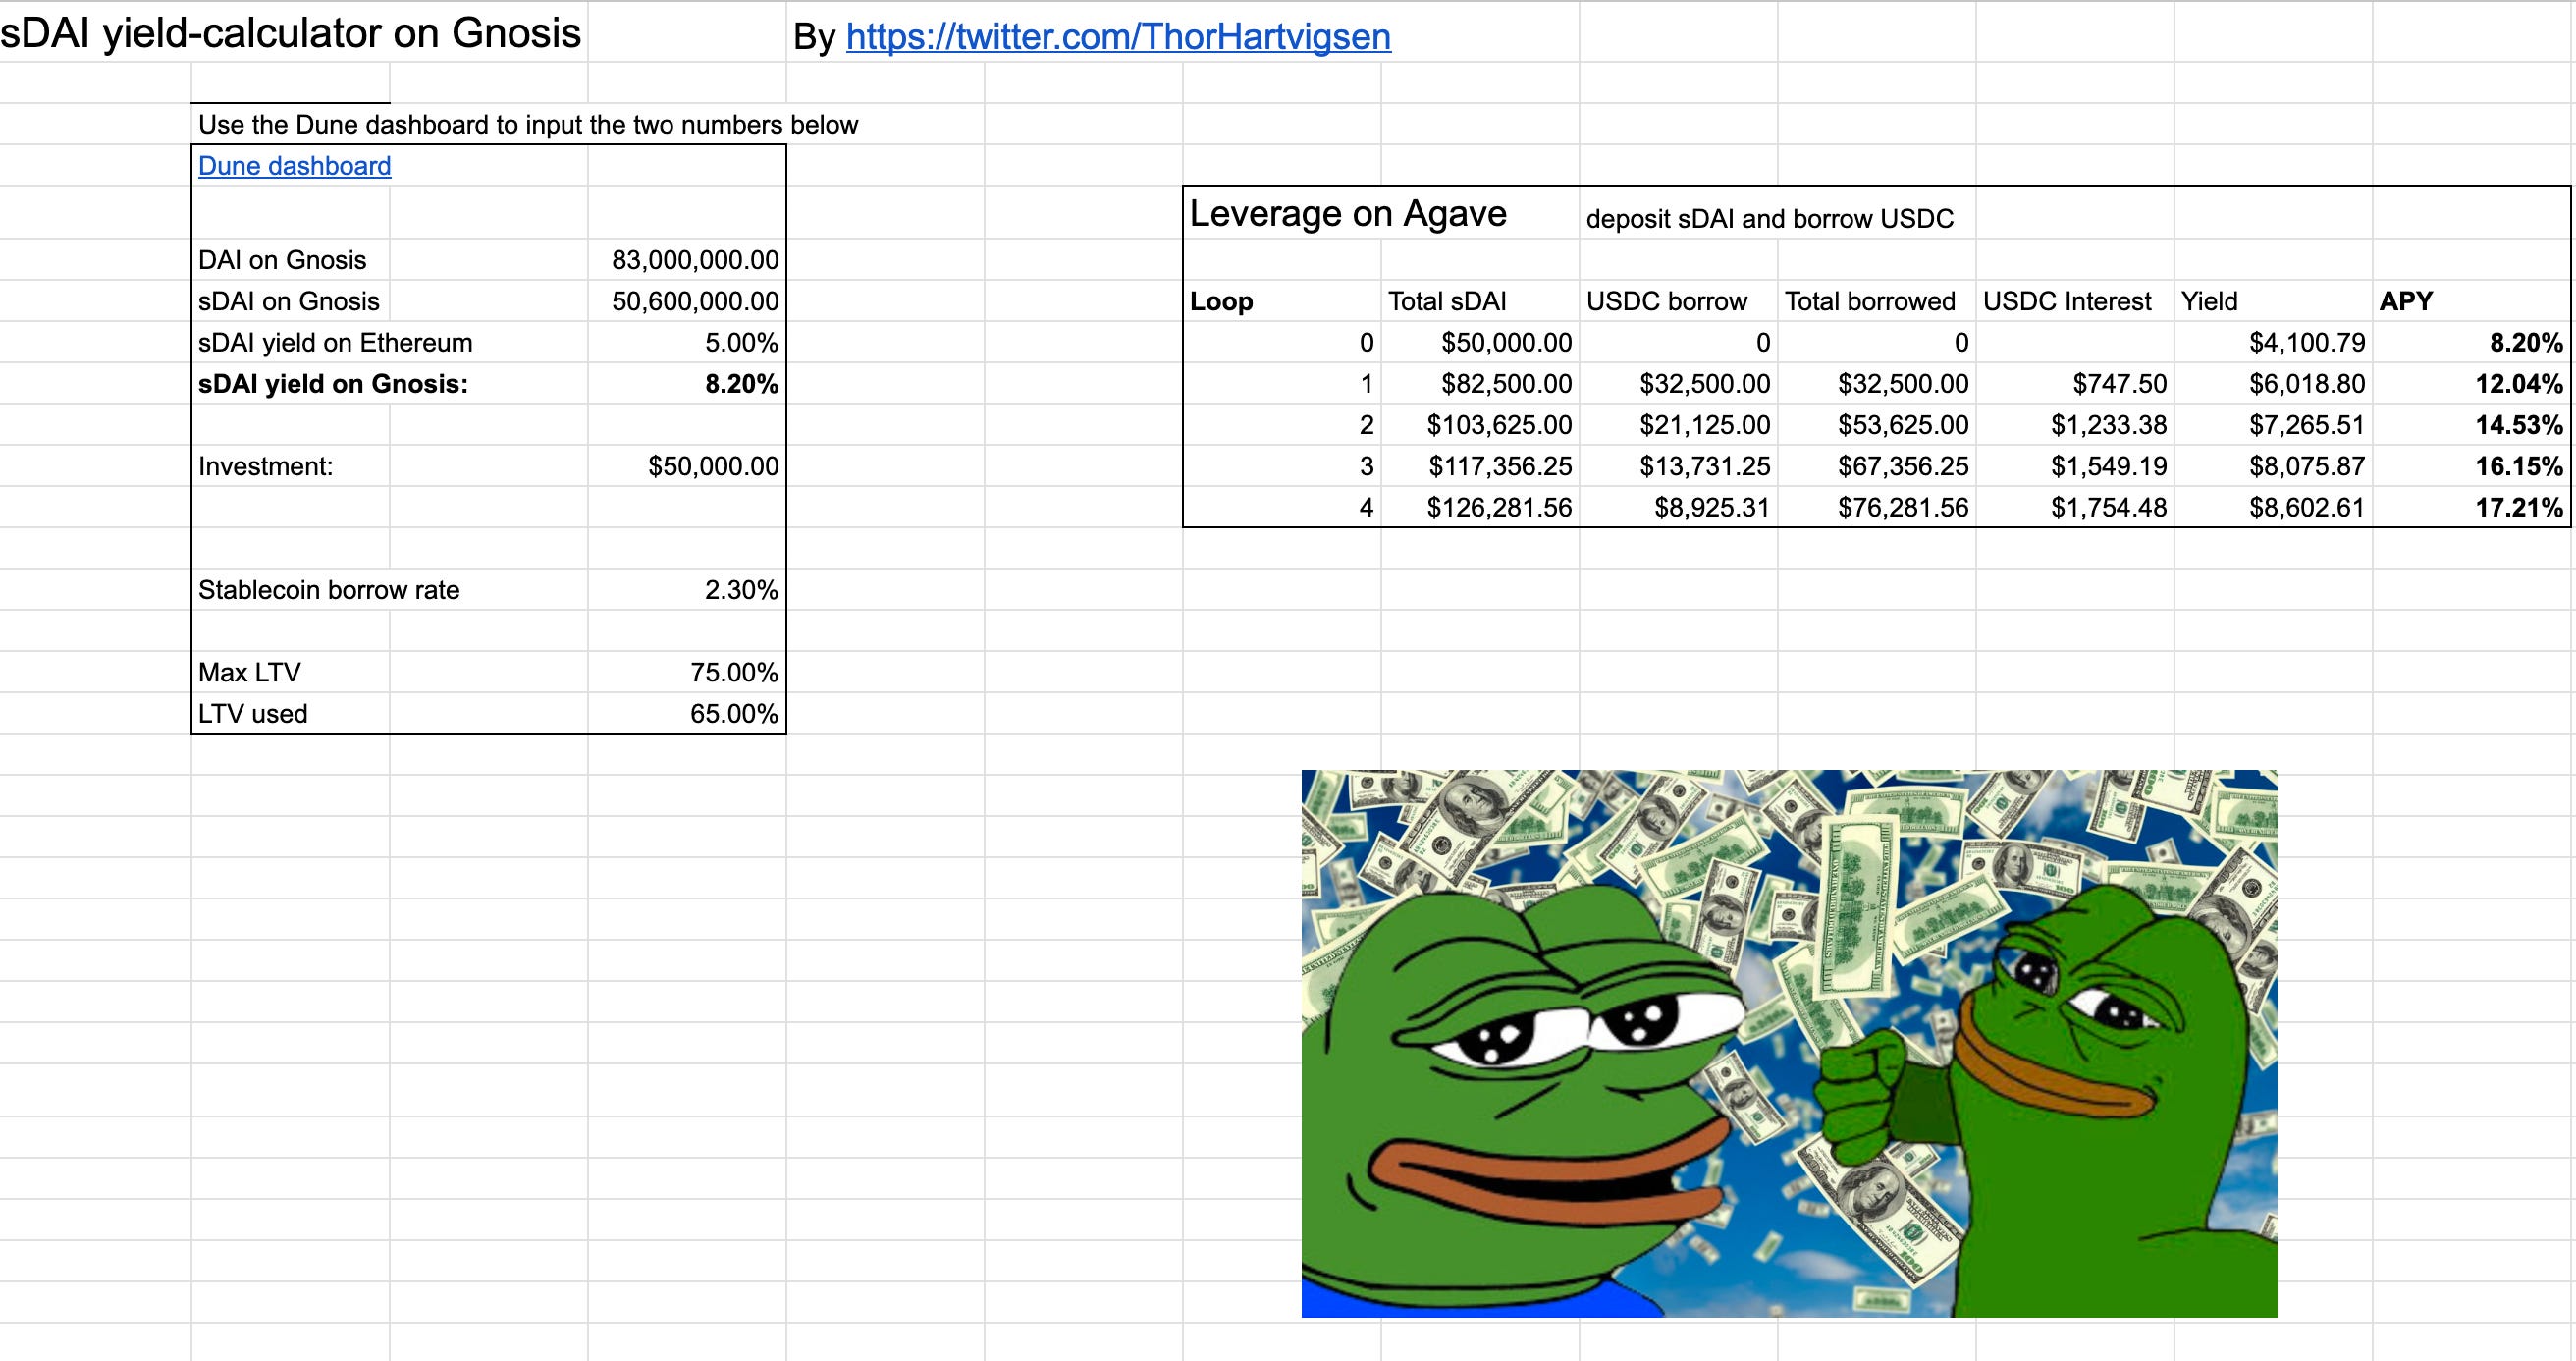
You can also check out the calculator here, in order to play around with these numbers yourself.
Here is a video guide explaining all of the steps required for this strategy.
Thanks for reading! If you found the newsletter valuable don’t forget to subscribe to receive the newsletter in your inbox every week. Also, I really appreciate any feedback in the comments below - Have a fantastic rest of the week! ☀️
Nothing stated is financial advice!


