Analyzing HLP & JLP Returns


Introduction
HLP and JLP are two popular DeFi products with close to $2b in combined deposits. While they are quite different by design, both act as market makers on their respective perpetual futures exchanges (Hyperliquid and Jupiter). But exactly how well have these products performed both this and last year? And in which ways are they different? These questions and more will be answered in today's report uncovering HLP and JLP and their respective returns over the past year. If you're new to On Chain Times, make sure to subscribe and join more than 12,000 readers.
Sponsor - Kamino Finance
Today's report is sponsored by Kamino Finance.
Kamino offers the best way to access leverage on your JLP by depositing it into the lending market as collateral and borrowing either USDC, USDT or PYUSD against it. Borrow rates are cheap at the moment and USDT can be borrowed at a cost of 10.17% annually. JLP is currently is earning 15%+ from fees paid by traders and looping this asset on Kamino can therefore boost the yield earned. This can be fully automated via 'Kamino Multiply' where up to 6x leverage is available. Keep in mind that the liquidation LTV is 0.85 and the more leverage the higher is the risk of liquidation.
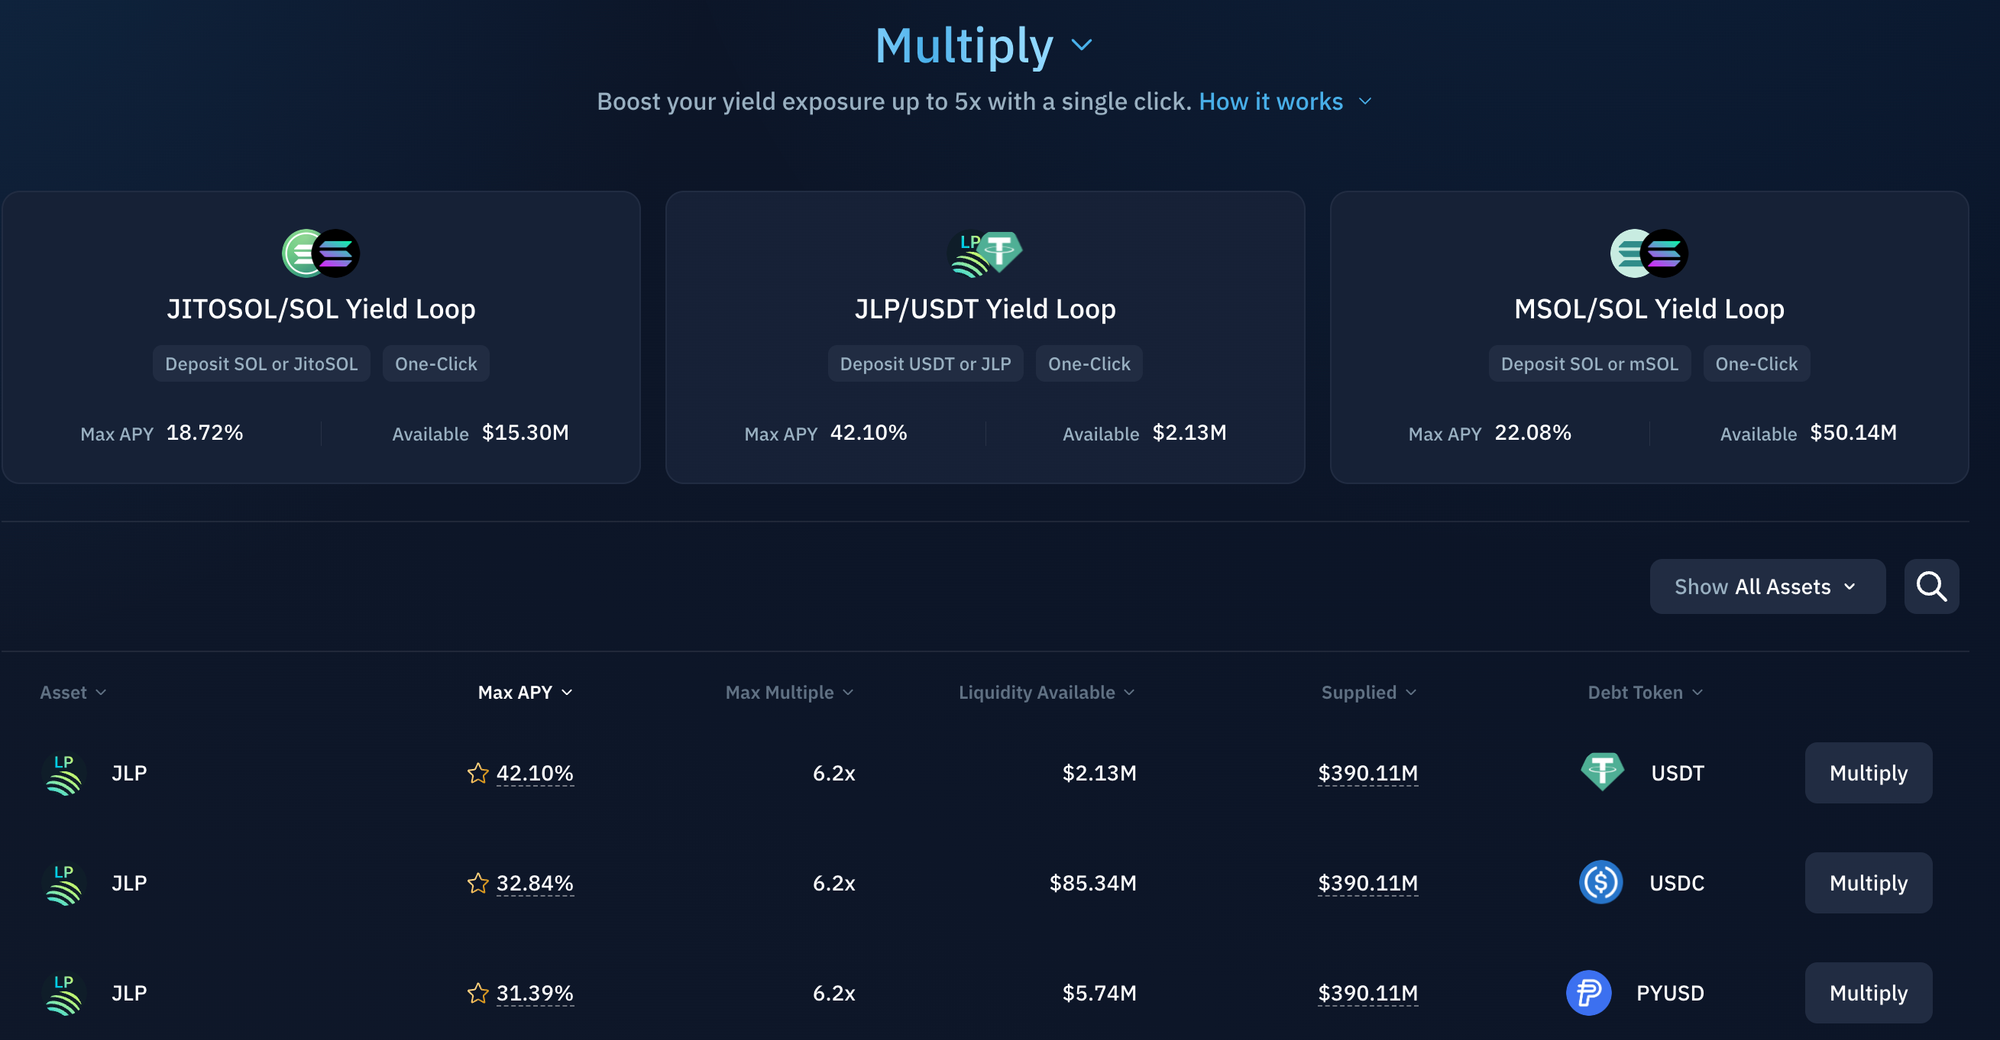
If you're interested in JLP and earning additional yield on this asset, make sure to check out Kamino Finance.
You can also read more about this strategy here or find out more about JLP later in today's report.
HLP
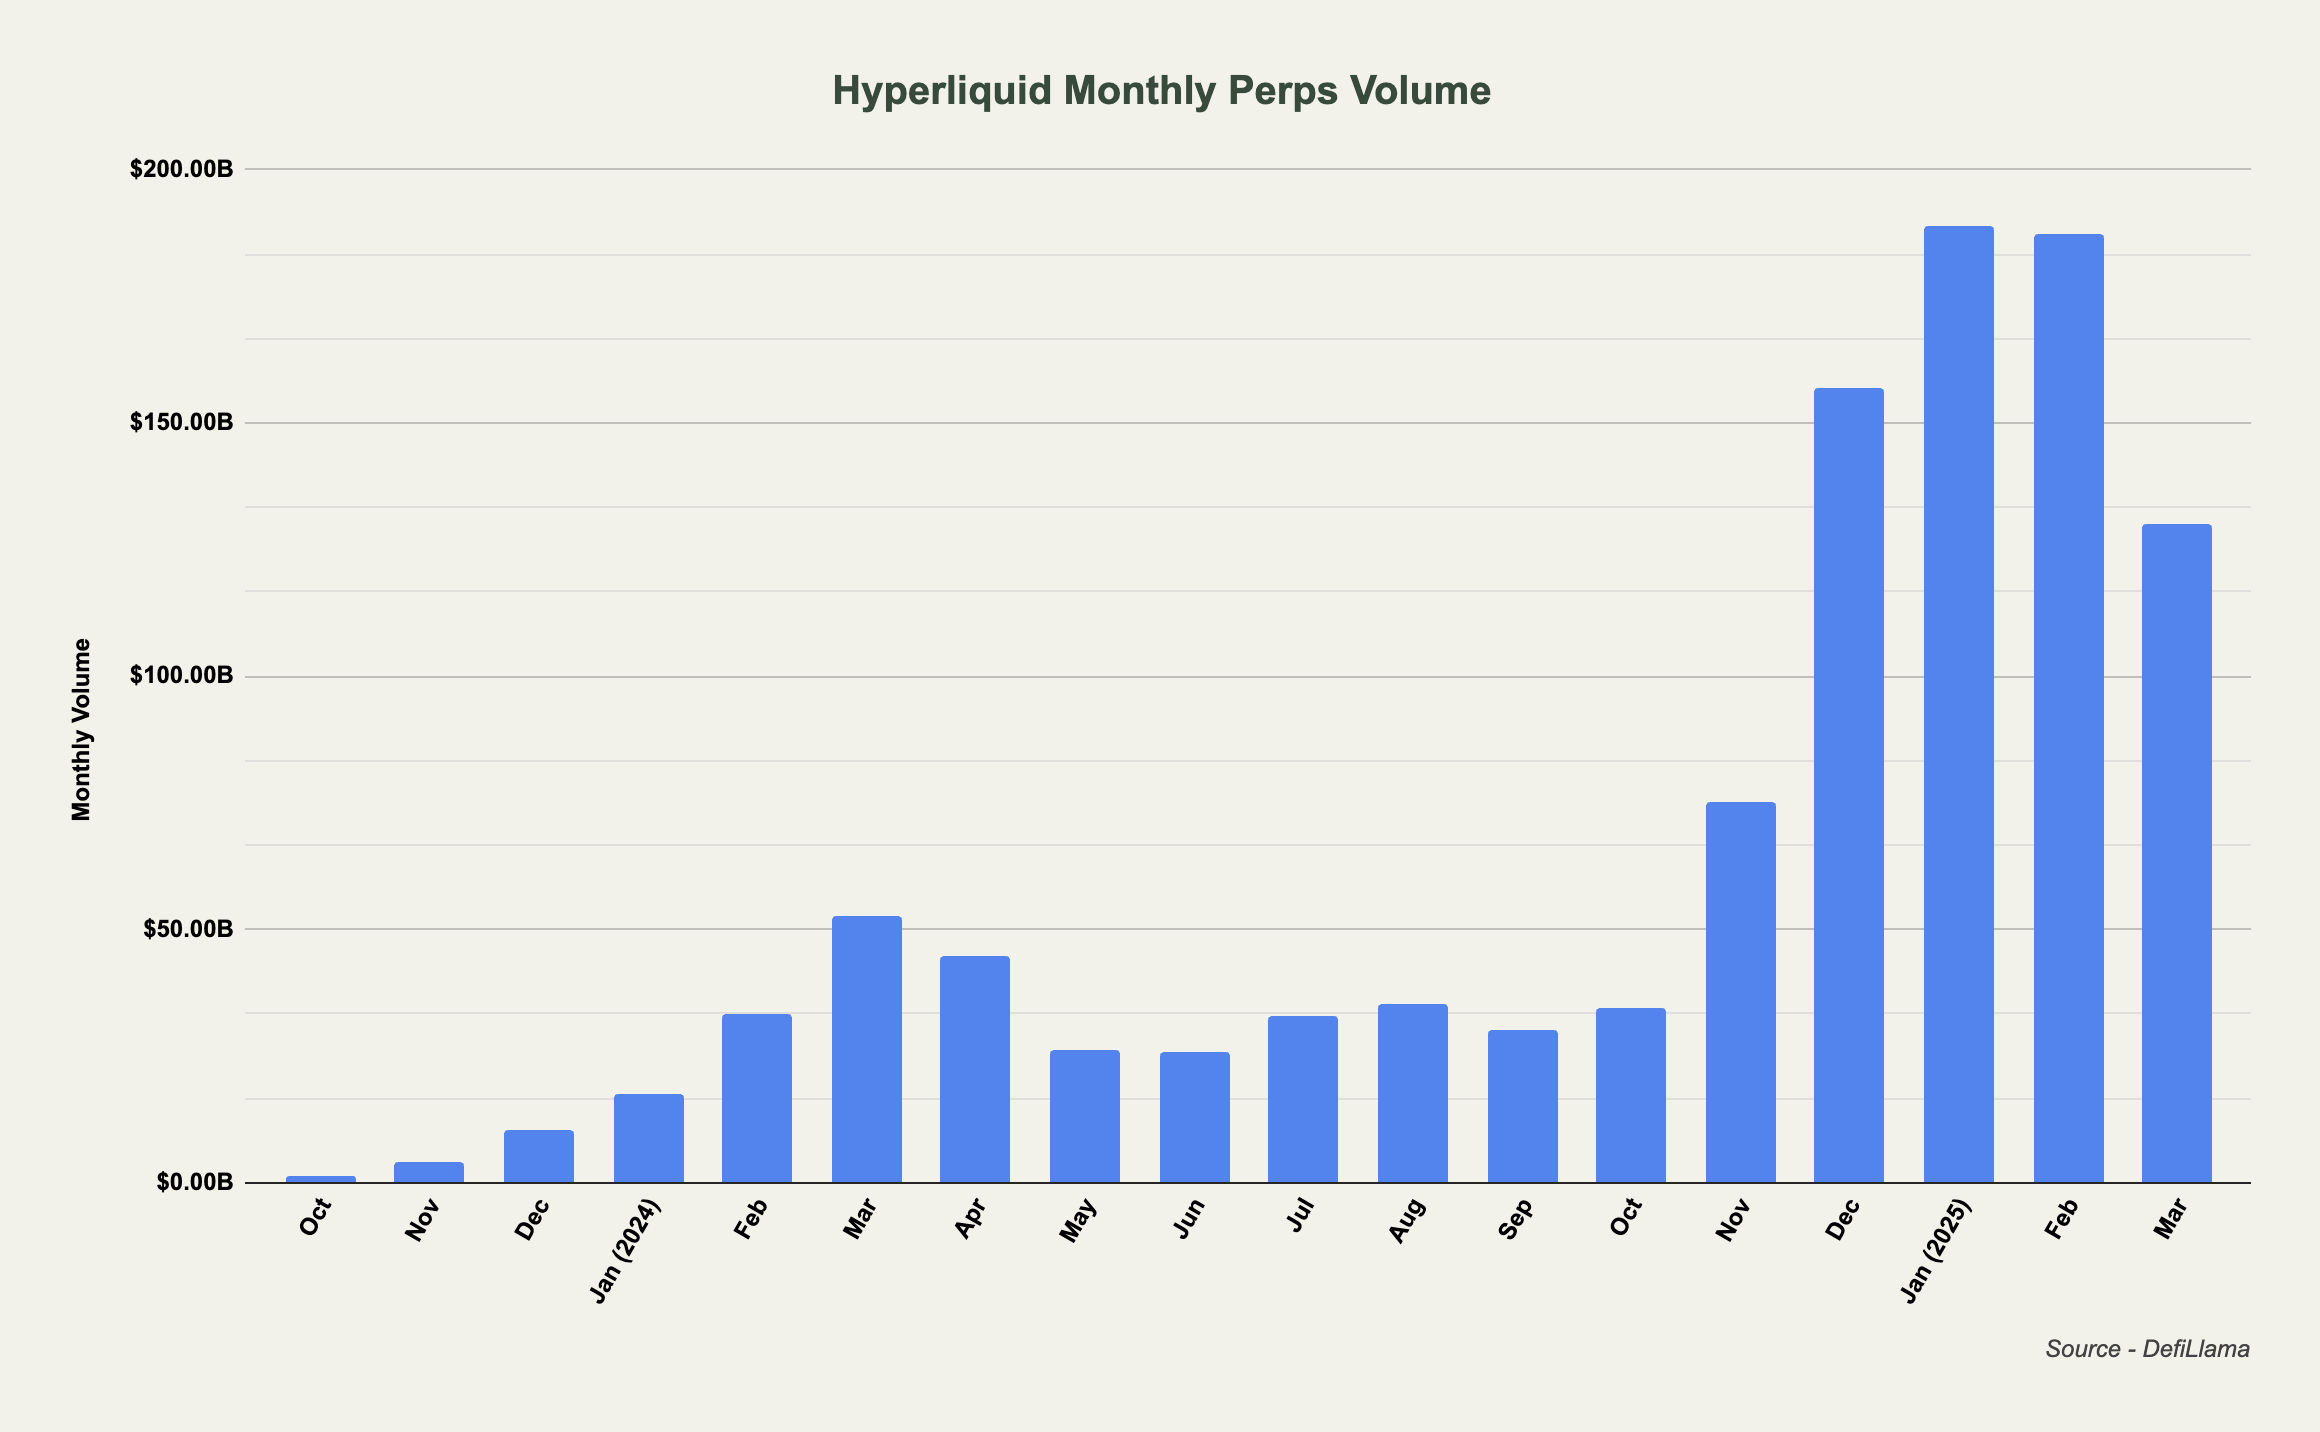
Hyperliquid is the largest on chain perpetuals exchange and is the first real competitor to CEXs like Bybit and Binance, facilitating more than $100b in trading volume per month month.
For anyone unfamiliar with Hyperliquid, feel free to check out the report below from last year where we interviewed xulian.hl.
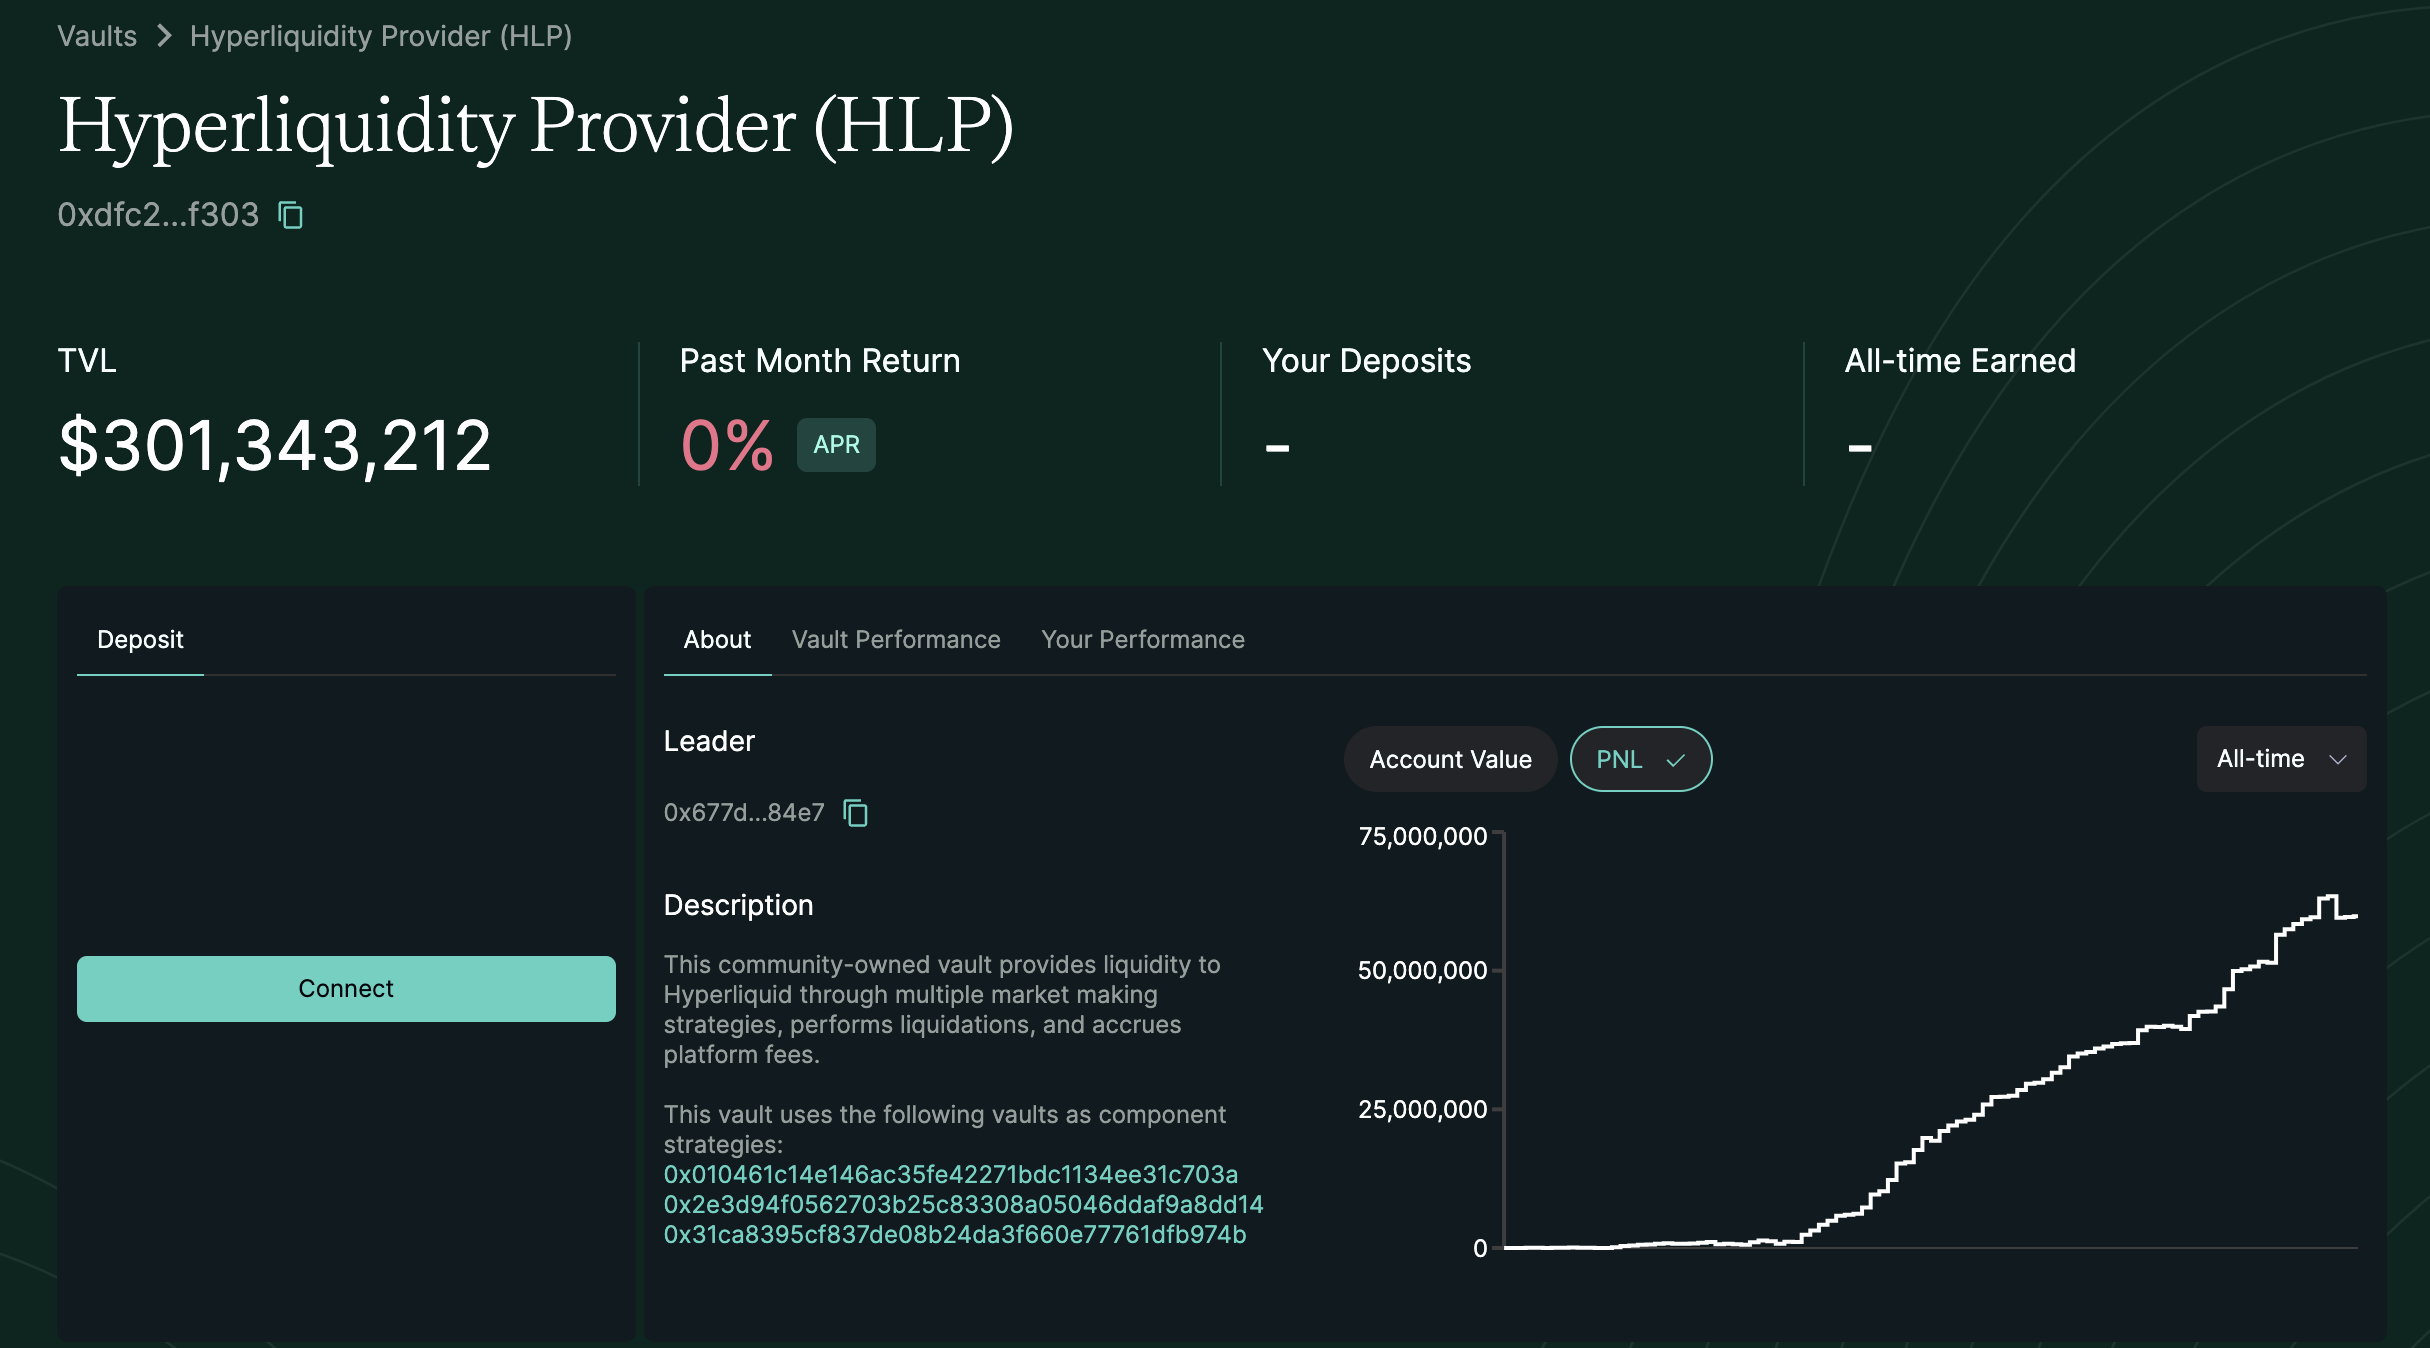
The Hyperliquidity Provider (HLP) is the largest vault on Hyperliquid and acts as the native market maker on the exchange. As per the description on the webpage:
This community-owned vault provides liquidity to Hyperliquid through multiple market making strategies, performs liquidations, and accrues platform fees.
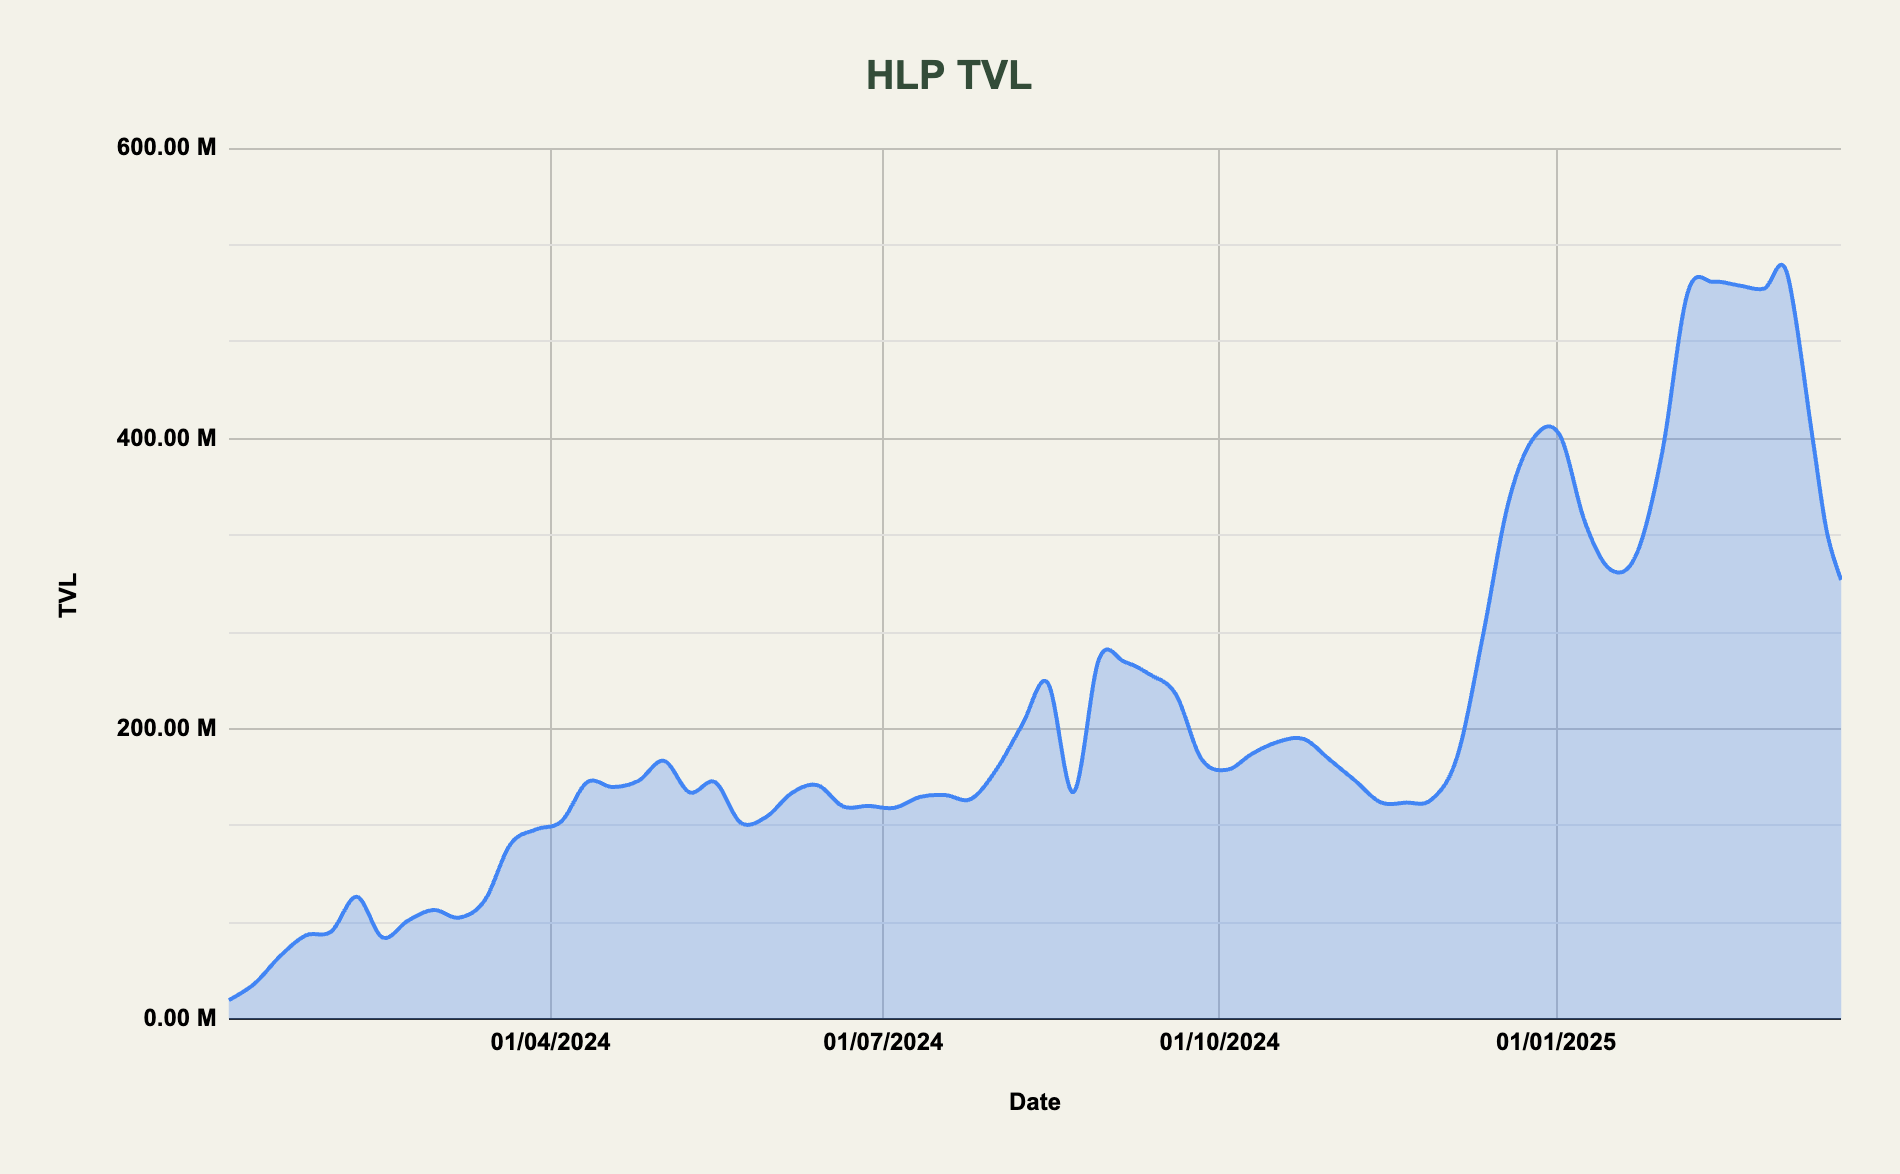
HLP most likely remains the biggest market maker on Hyperliquid and has more than $300m in deposits at the time of writing. Last week, HLP saw a big outflow of nearly 40% of its TVL after the vault experienced a $4m single-day loss from a sophisticated trader who took advantage of the margin requirement design.
While this design has been updated since to prevent an incident like this to happen again, it led to wide concerns resulting in large outflows from the market making vault. It should be mentioned however that the $4m loss was equivalent to ~2 weeks of profit and that this is pretty insignificant in the broader scheme of things. On a larger timeframe, the HLP vault still remains one of the best performing strategies from a risk-adjusted perspective.
This incident, however, peaked my interest and made me curious as to what returns HLP has been offering depositors since the beginning of 2024. There is little data available on HLP aside from what's displayed on the UI above. Therefore, the vault returns are aggregated on a weekly rather than daily basis which might cause slight inaccuracies (I am however fairly confident that the numbers are fairly accurate).
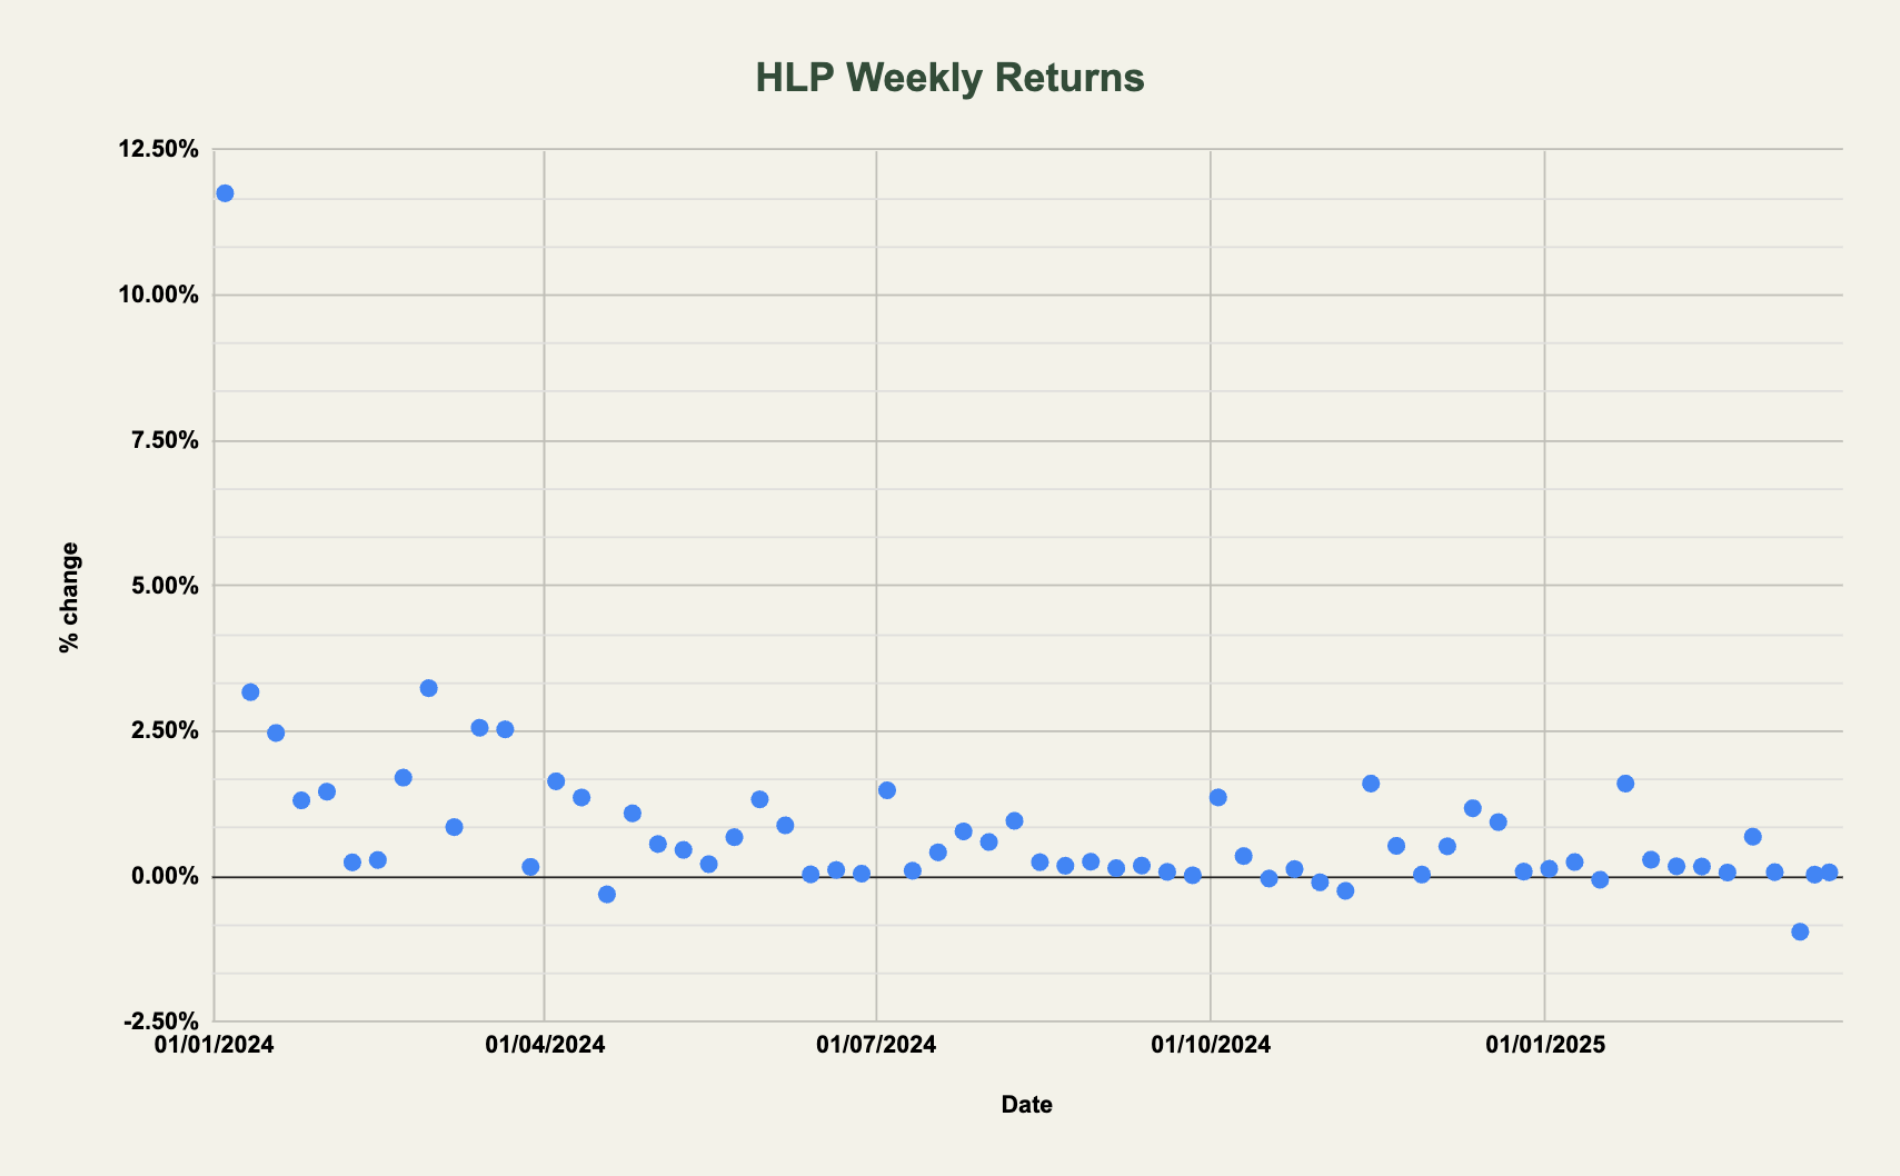
The chart below depicts the weekly returns for HLP based on PnL and vault TVL. In the early days of HLP, there were several weeks with 2.5% returns which primarily was a result of low vault TVL. Of the 64 weeks since Jan 1st 2024, only 6 have had a negative return with the average weekly return of 0.84%.
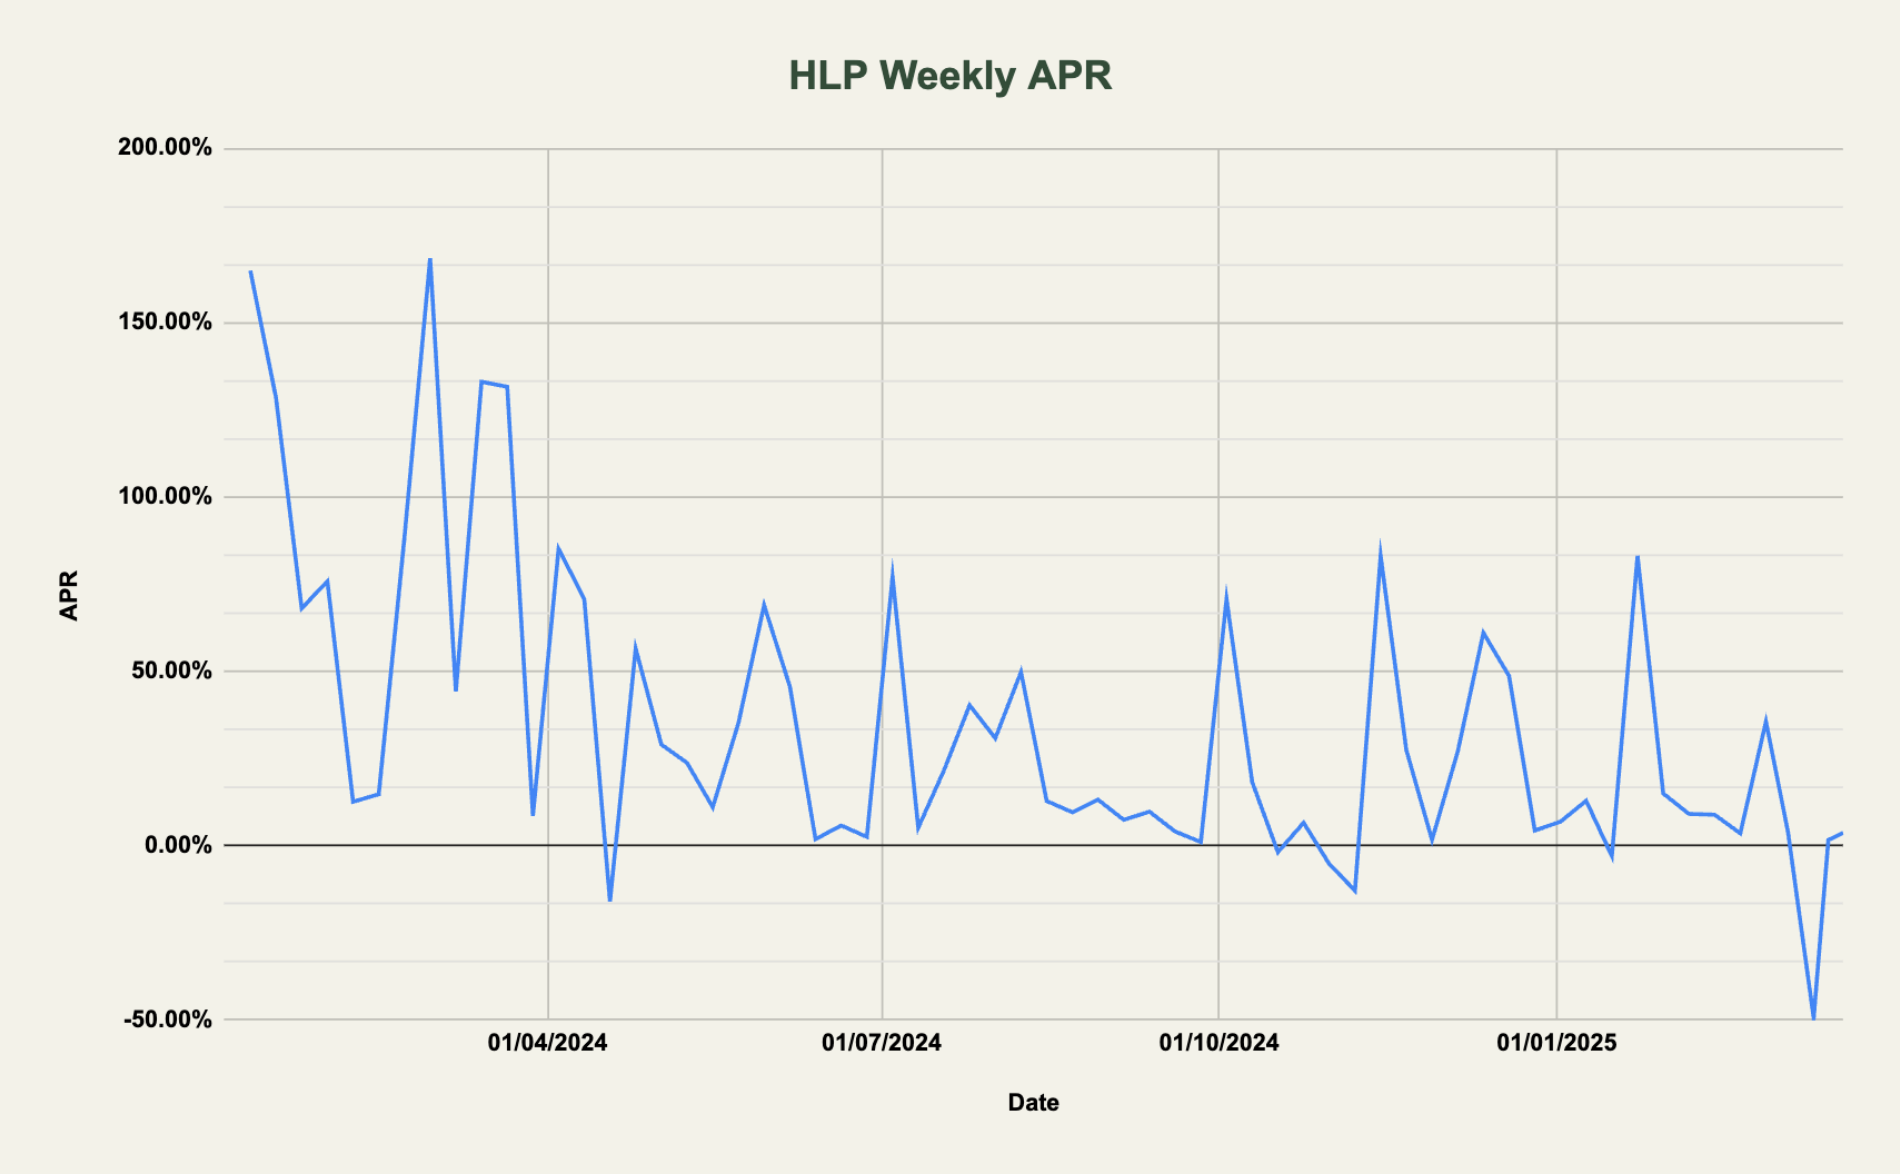
Over time, HLP has grown significantly in size and even though trading volume has increase a lot on Hyperliquid as well, the HLP returns have compressed. The chart below shows the weekly APRs (with the outlier Jan 4th 2024 excluded) over time. With the $4m loss last week, the average APR this year has been 12.07%. The recent outflow of >$200m from the HLP vault could perhaps result higher returns going forward conditioned on the trading volumes staying at current levels.
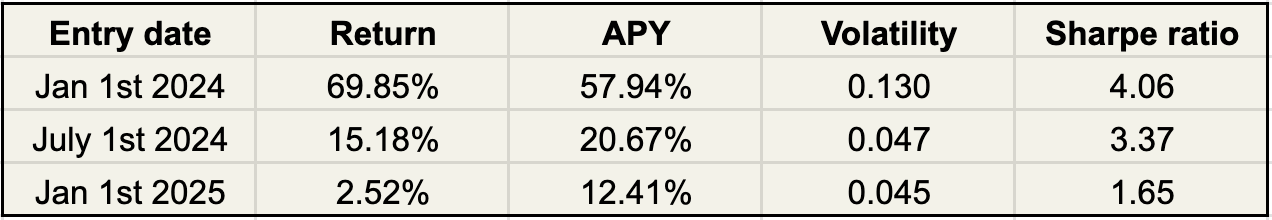
Taking the analysis a step further, we can view HLP from a volatility-adjusted perspective. One of the key benefits of HLP is its very low volatility. The table below shows the return, APY, volatility and Sharpe ratio depending on when one were to enter the vault. Since Jan 1st 2024, the Sharpe ratio has been >4 for over 15 months which is quite impressive. The Sharpe ratio has decreased over time and since the beginning of this year the Sharpe ratio is at 1.65. Relative to other strategies and namely assets like BTC, ETH and SOL this is however not bad at all.
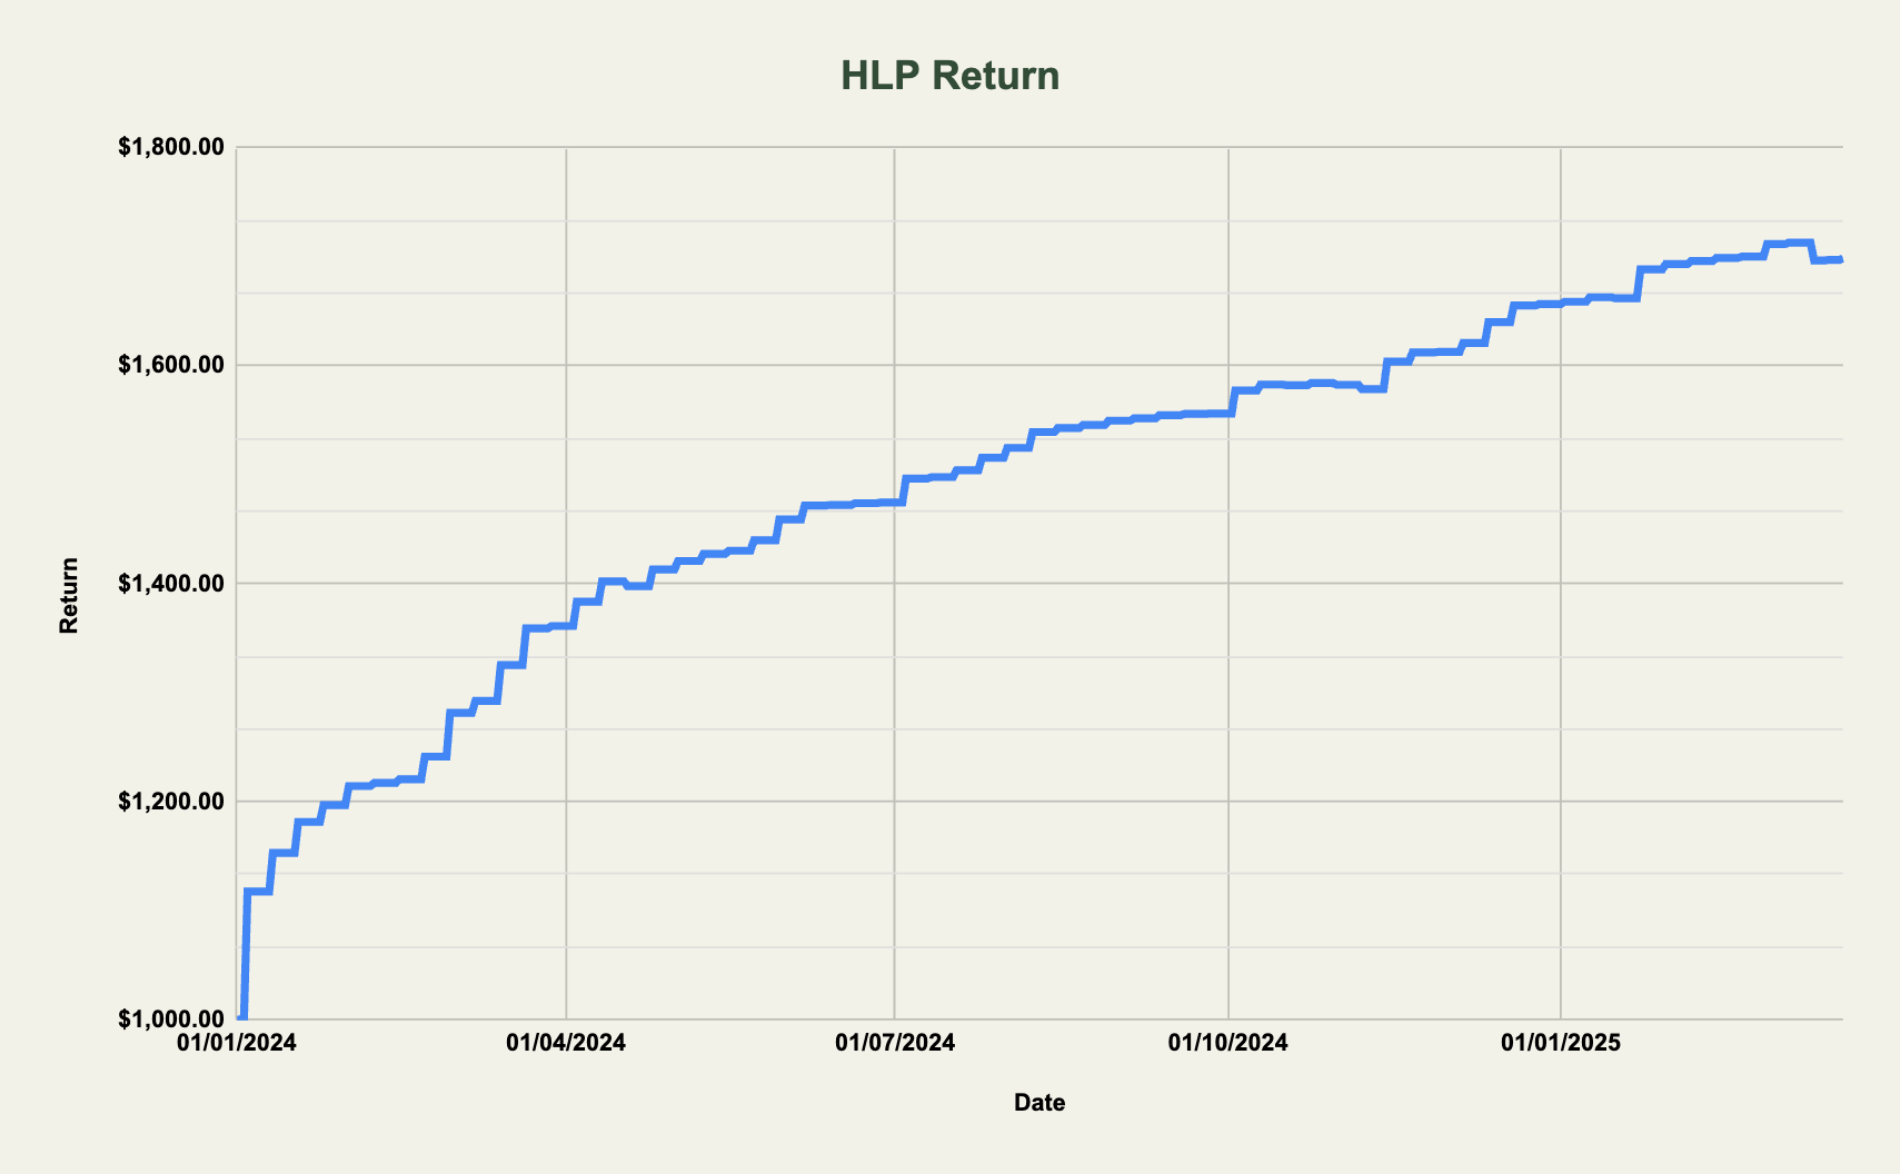
While the HLP returns have taken a haircut recently, over time the strategy is expected to do well. An example of returns compounding, the chart below shows a $1000 deposit at the beginning of 2024 which is up 70%.
JLP
Let's now look at JLP, the liquidity token powering the Jupiter perps exchange. In contrast to Hyperliquid, Jupiter doesn't use an orderbook for liquidity but rather an AMM style product (popularized by GMX). With JLP at the core of this design, the token captures 75% of all fees paid by traders. JLP consists of a basket of assets (SOL, BTC, ETH and stablecoins). The price is determined by the price action of the underlying tokens, the fees paid by traders and finally the PnL of the traders. To learn more about the design of JLP, feel free to check out the article below.

JLP has been mentioned on On Chain Times on many occasions before due to its historically high Sharpe ratio and up-only price action. This year however, the JLP price chart is looking quite different as seen below which is a result of SOL, BTC and ETH experiencing significant drawdowns. As JLP consists of ~45% SOL it is especially sensitive to the price of this asset.
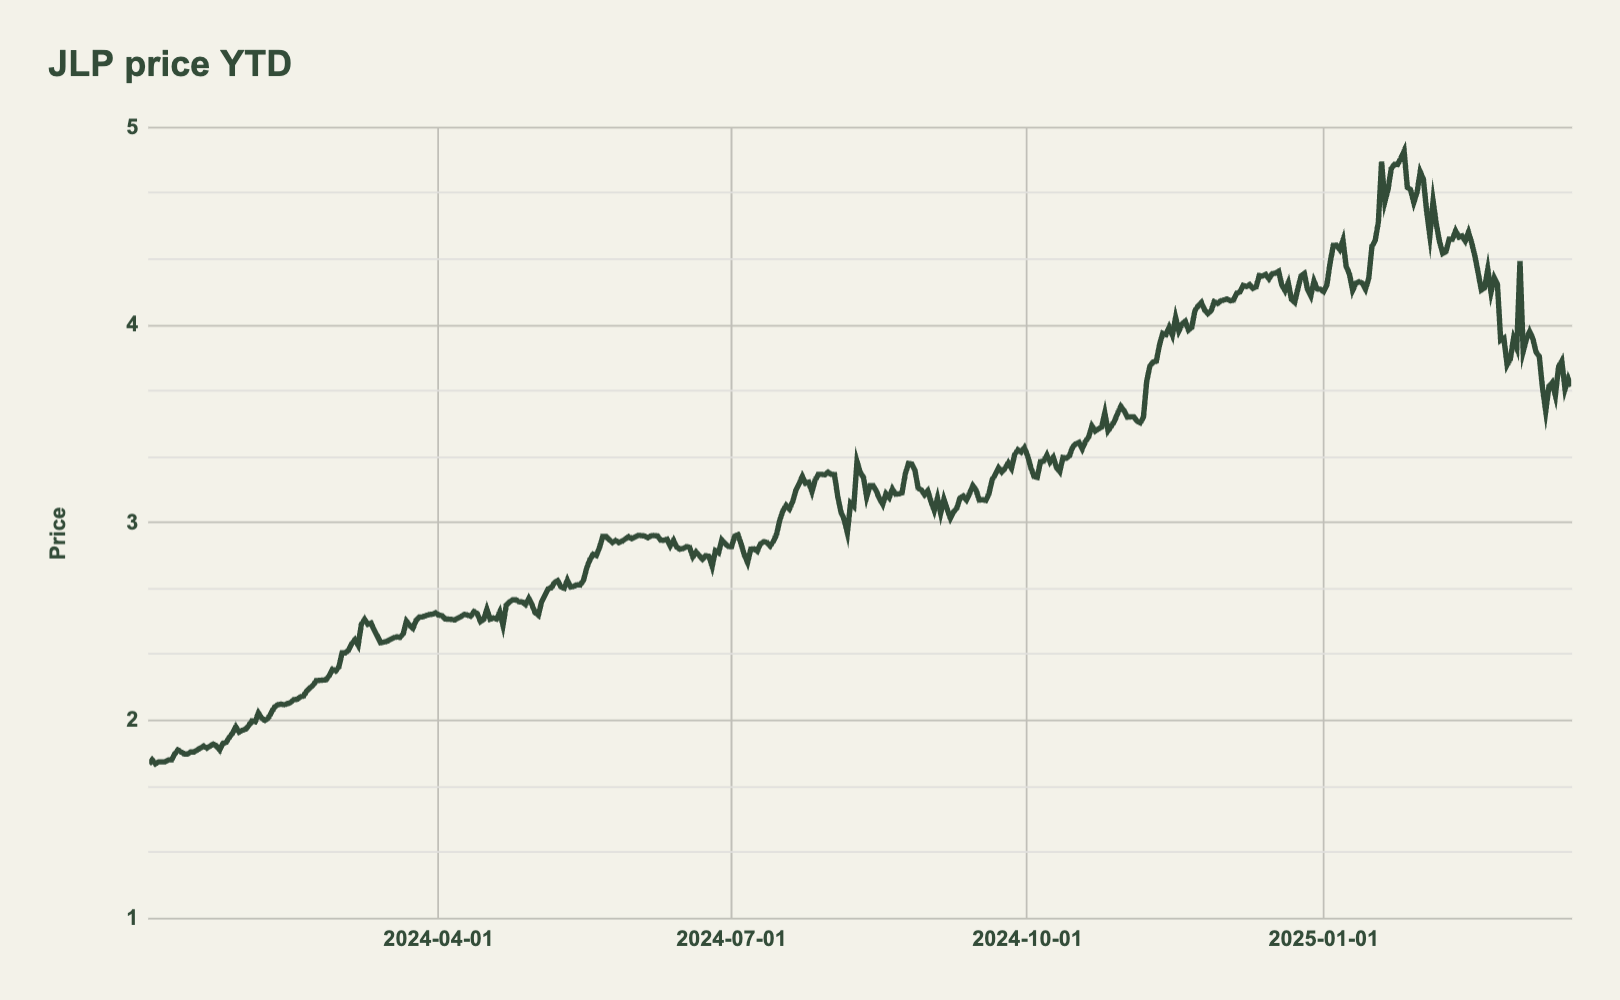
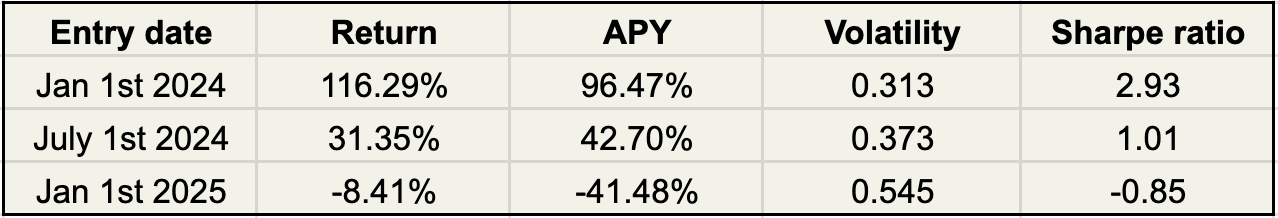
Similar to HLP, we can take a look at the returns from entering JLP at different periods. JLP has had an impressive 116% return since the beginning of 2024 which is a result of positive price action for BTC and SOL but also a large amount of fees being paid by traders to JLP throughout this period.
As seen from the table, while the returns are higher for JLP relative to HLP both from Jan 1st 2024 and July 1st 2024, the Sharpe ratio is lower (2.93 vs 4.06). This is due to JLP having more volatility in it's daily price fluctuations which is a result of being highly correlated with its underlying assets (SOL, BTC and ETH).
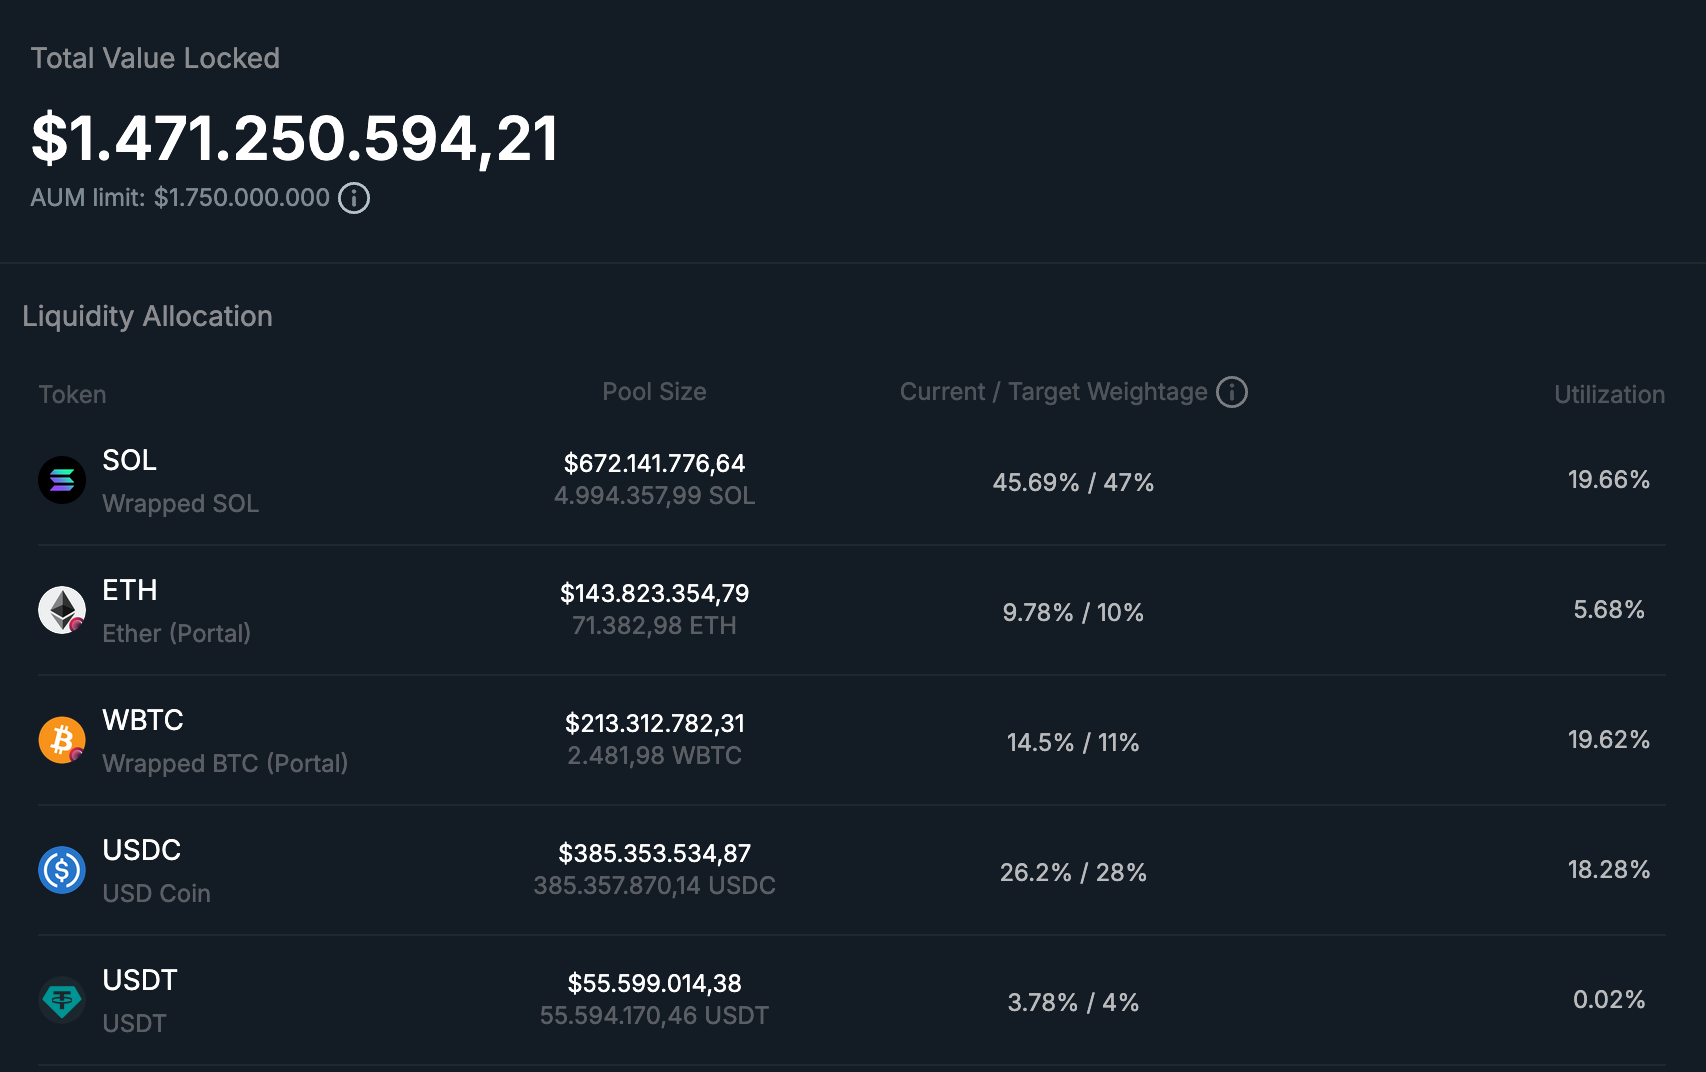
JLP is down 24% from its highs earlier this year (while SOL is down 55%) which, depending on how you view it, either presents a potentially good opportunity to enter JLP at a discount or alternatively a potential end to JLPs previous impressive performance. One thing that's important to keep in mind if you're considering investing in JLP is that you are effectively taking a pretty bullish stance on SOL. For every $1 of JLP, you're effectively holding $0.45 of SOL:
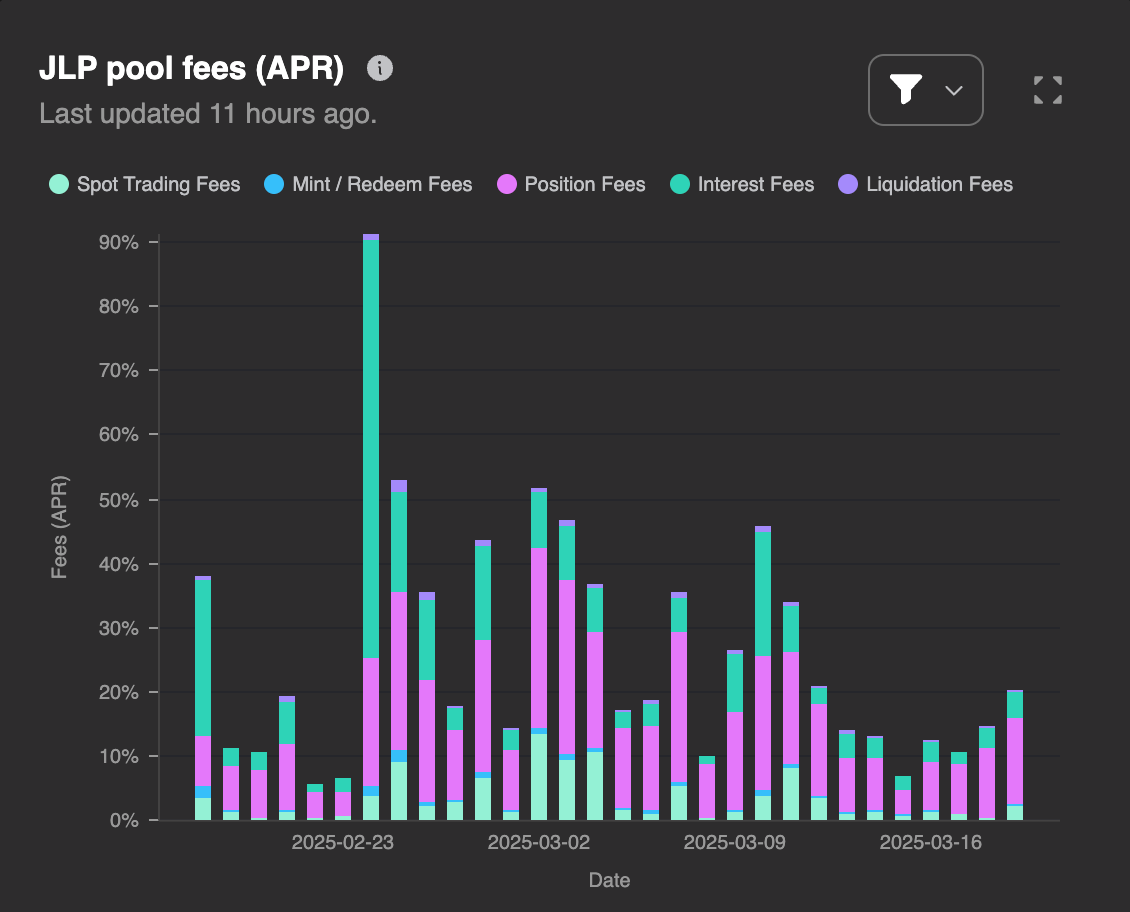
It's also worth noting that the fees APR has come down significantly from earlier this year as trading activity has cooled off across the market. The fees paid by traders have historically been a big contributor to JLP's outperformance relative to majors like BTC, ETH and SOL and is a metric you should keep track of if you hold JLP.
Some dashboards to view more JLP stats:
Conclusion
Both JLP and HLP have historically been solid investments that have outperformed the broad crypto market from a volatility-adjusted perspective. While both are off to a tough start this year, looking at historical performance, these should do well on a larger time frame (given that both exchanges continue to facilitate significant trading volume). It is also important to realize that these two products are very different by design and present different risks and levels of market exposure. Also keep in mind that, like all products in DeFi, smart contract risk is a real thing and something to consider before depositing into these products.
Disclaimer
The information provided is for general informational purposes only and does not constitute financial, investment, or legal advice. The content is based on sources believed to be reliable, but its accuracy, completeness, and timeliness cannot be guaranteed. Any reliance you place on the information in this document is at your own risk. On Chain Times may contain forward-looking statements that involve risks and uncertainties. Actual results may differ materially from those expressed or implied in such statements. The authors may or may not own positions in the assets or securities mentioned herein. They reserve the right to buy or sell any asset or security discussed at any time without notice. It is essential to consult with a qualified financial advisor or other professional to understand the risks and suitability of any investment decisions you may make. You are solely responsible for conducting your research and due diligence before making any investment choices. Past performance is not indicative of future results. The authors disclaim any liability for any direct, indirect, or consequential loss or damage arising from the use of this document or its content. By accessing On Chain Times, you agree to the terms of this disclaimer.